Humana 2004 Annual Report Download - page 40
Download and view the complete annual report
Please find page 40 of the 2004 Humana annual report below. You can navigate through the pages in the report by either clicking on the pages listed below, or by using the keyword search tool below to find specific information within the annual report.-
 1
1 -
2
-
3
-
4
-
5
-
6
-
7
-
8
-
9
-
10
-
11
-
12
-
13
-
14
-
15
-
16
-
17
-
18
-
19
-
20
-
21
-
22
-
23
-
24
-
25
-
26
-
27
-
28
-
29
-
 30
30 -
 31
31 -
 32
32 -
 33
33 -
 34
34 -
 35
35 -
 36
36 -
 37
37 -
 38
38 -
 39
39 -
 40
40 -
 41
41 -
 42
42 -
 43
43 -
 44
44 -
 45
45 -
 46
46 -
 47
47 -
 48
48 -
 49
49 -
 50
50 -
51
-
52
-
53
-
54
-
55
-
56
-
57
-
58
-
59
-
60
-
61
-
62
-
63
-
64
-
65
-
66
-
67
-
68
-
69
-
70
-
71
-
72
-
73
-
74
-
75
-
76
-
77
-
78
-
79
-
80
-
81
-
82
-
83
-
84
-
85
-
86
-
87
-
88
-
89
-
90
-
91
-
92
-
93
-
94
-
95
-
96
-
97
-
98
-
99
-
100
-
101
-
102
-
103
-
104
-
105
-
106
-
107
-
108
-
109
-
110
-
111
-
112
-
113
-
114
-
115
-
116
-
117
-
118
-
119
-
120
-
121
-
122
-
123
-
124
 |
 |
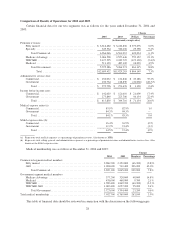
For the Commercial segment, administrative services fees increased $43.2 million, or 35.2%, from $122.8
million for 2003 to $166.0 million for 2004. This increase corresponds to the higher level of ASO membership at
December 31, 2004, which was 1,018,600 members, compared to 712,400 at December 31, 2003, an increase of
43%.
Administrative services fees for the Government segment decreased $42.1 million, or 28.3%, from $148.8
million for 2003 to $106.8 million for 2004. This decline resulted from the transition to the new South Region
contract which carved out certain government programs including the administration of pharmacy and medical
benefits to senior members over the age of 65. We stopped providing services under these separate programs
beginning June 1, 2004.
Investment and Other Income
Investment and other income totaled $142.1 million in 2004, an increase of $12.7 million from $129.4
million in 2003. This increase primarily resulted from an increase in the average invested balance partially offset
by a decrease in net realized capital gains of approximately $8.4 million. The investment of cash flows from
operations contributed to the increase in the average invested balance and added approximately $18.8 million to
interest income. The average yield on investment securities was 3.6% in 2004 compared to 3.5% in 2003.
Medical Expense
The consolidated MER for 2004 was 84.1%, increasing 60 basis points from 83.5% for 2003 primarily due
to the increase in the MER for the Commercial segment.
The Commercial segment’s MER for 2004 was 83.9%, increasing 100 basis points from 2003 of 82.9%. The
100 basis point increase was primarily due to underwriting losses associated with a large customer account
serving approximately 89,000 members and a very competitive pricing environment in the 2 to 300 life customer
segment. The 89,000 large group account lapsed on January 1, 2005. Increasing per member premiums
commensurate with claims trend becomes more difficult in a competitive pricing environment. Fully insured
commercial medical cost trends are expected to rise in the range of 6.5% to 8.5% for 2005, including the
lowering effect of approximately 200 basis points due to a growing mix of Individual membership.
The Government segment’s MER for 2004 was 84.3%, flat when compared to 2003. The Medicare
Advantage premium increases were consistent with medical cost increases for 2004 reflecting our efforts of
adjusting benefit levels commensurate with reimbursement rates.
SG&A Expense
The consolidated SG&A expense ratio for 2004 was 14.5%, decreasing 90 basis points from 15.4% for
2003. This decrease, as well as the decrease in each of our segments’ SG&A expense ratio, is the result of
revenue growth in excess of administrative cost inflation and operational efficiencies including gains from
completing the consolidation of seven service centers into four during 2003. Included in 2003 were costs of $17.2
million from the impairment of the Jacksonville, Florida service center building more fully described in Note 5 to
the consolidated financial statements. These costs increased the 2003 SG&A expense ratio 10 basis points. The
consolidated SG&A expense ratio is expected to be in the range of 13.5% to 14.5% for 2005 reflecting the
continuing beneficial effect of growth in revenues and membership leveraging fixed costs.
The Commercial segment SG&A expense ratio decreased 50 basis points from 16.9% for 2003 to 16.4% for
2004. The Commercial segment SG&A expense ratio for 2003 included an approximate 10 basis point impact
from the Jacksonville, Florida building writedown.
30