Humana 2004 Annual Report Download - page 38
Download and view the complete annual report
Please find page 38 of the 2004 Humana annual report below. You can navigate through the pages in the report by either clicking on the pages listed below, or by using the keyword search tool below to find specific information within the annual report.-
 1
1 -
2
-
3
-
4
-
5
-
6
-
7
-
8
-
9
-
10
-
11
-
12
-
13
-
14
-
15
-
16
-
17
-
18
-
19
-
20
-
21
-
22
-
23
-
24
-
25
-
26
-
27
-
 28
28 -
 29
29 -
 30
30 -
 31
31 -
 32
32 -
 33
33 -
 34
34 -
 35
35 -
 36
36 -
 37
37 -
 38
38 -
 39
39 -
 40
40 -
 41
41 -
 42
42 -
 43
43 -
 44
44 -
 45
45 -
 46
46 -
 47
47 -
 48
48 -
49
-
50
-
51
-
52
-
53
-
54
-
55
-
56
-
57
-
58
-
59
-
60
-
61
-
62
-
63
-
64
-
65
-
66
-
67
-
68
-
69
-
70
-
71
-
72
-
73
-
74
-
75
-
76
-
77
-
78
-
79
-
80
-
81
-
82
-
83
-
84
-
85
-
86
-
87
-
88
-
89
-
90
-
91
-
92
-
93
-
94
-
95
-
96
-
97
-
98
-
99
-
100
-
101
-
102
-
103
-
104
-
105
-
106
-
107
-
108
-
109
-
110
-
111
-
112
-
113
-
114
-
115
-
116
-
117
-
118
-
119
-
120
-
121
-
122
-
123
-
124
 |
 |

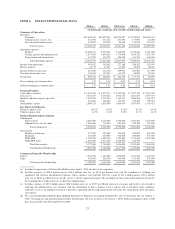
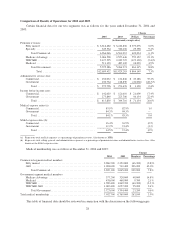
Comparison of Results of Operations for 2004 and 2003
Certain financial data for our two segments was as follows for the years ended December 31, 2004 and
2003:
Change
2004 2003 Dollars Percentage
(in thousands, except ratios)
Premium revenues:
Fully insured ......................................... $ 6,614,482 $ 6,240,806 $ 373,676 6.0%
Specialty ............................................ 349,564 320,206 29,358 9.2%
Total Commercial ................................. 6,964,046 6,561,012 403,034 6.1%
Medicare Advantage ................................... 3,086,598 2,527,446 559,152 22.1%
TRICARE ........................................... 2,127,595 2,249,725 (122,130) (5.4)%
Medicaid ............................................ 511,193 487,100 24,093 4.9%
Total Government ................................. 5,725,386 5,264,271 461,115 8.8%
Total ....................................... $12,689,432 $11,825,283 $ 864,149 7.3%
Administrative services fees:
Commercial .......................................... $ 166,032 $ 122,846 $ 43,186 35.2%
Government ......................................... 106,764 148,830 (42,066) (28.3)%
Total ........................................... $ 272,796 $ 271,676 $ 1,120 0.4%
Income before income taxes:
Commercial .......................................... $ 142,010 $ 121,010 $ 21,000 17.4%
Government ......................................... 273,840 223,706 50,134 22.4%
Total ........................................... $ 415,850 $ 344,716 $ 71,134 20.6%
Medical expense ratios (a):
Commercial .......................................... 83.9% 82.9% 1.0
Government ......................................... 84.3% 84.3% —
Total ........................................... 84.1% 83.5% 0.6
SG&A expense ratios (b):
Commercial .......................................... 16.4% 16.9% (0.5)
Government ......................................... 12.2% 13.4% (1.2)
Total ........................................... 14.5% 15.4% (0.9)
(a) Represents total medical expenses as a percentage of premium revenue. Also known as MER.
(b) Represents total selling, general, and administrative expenses as a percentage of premium revenues and administrative services fees. Also
known as the SG&A expense ratio.
Medical membership was as follows at December 31, 2004 and 2003:
Change
2004 2003 Members Percentage
Commercial segment medical members:
Fully insured .............................................. 2,286,500 2,352,800 (66,300) (2.8)%
ASO .................................................... 1,018,600 712,400 306,200 43.0%
Total Commercial ...................................... 3,305,100 3,065,200 239,900 7.8%
Government segment medical members:
Medicare Advantage ........................................ 377,200 328,600 48,600 14.8%
Medicaid ................................................. 478,600 468,900 9,700 2.1%
TRICARE ................................................ 1,789,400 1,849,700 (60,300) (3.3)%
TRICARE ASO ........................................... 1,082,400 1,057,200 25,200 2.4%
Total Government ...................................... 3,727,600 3,704,400 23,200 0.6%
Total medical membership ....................................... 7,032,700 6,769,600 263,100 3.9%
This table of financial data should be reviewed in connection with the discussion on the following pages.
28