Humana 2004 Annual Report Download - page 99
Download and view the complete annual report
Please find page 99 of the 2004 Humana annual report below. You can navigate through the pages in the report by either clicking on the pages listed below, or by using the keyword search tool below to find specific information within the annual report.-
 1
1 -
2
-
3
-
4
-
5
-
6
-
7
-
8
-
9
-
10
-
11
-
12
-
13
-
14
-
15
-
16
-
17
-
18
-
19
-
20
-
21
-
22
-
23
-
24
-
25
-
26
-
27
-
28
-
29
-
30
-
31
-
32
-
33
-
34
-
35
-
36
-
37
-
38
-
39
-
40
-
41
-
42
-
43
-
44
-
45
-
46
-
47
-
48
-
49
-
50
-
51
-
52
-
53
-
54
-
55
-
56
-
57
-
58
-
59
-
60
-
61
-
62
-
63
-
64
-
65
-
66
-
67
-
68
-
69
-
70
-
71
-
72
-
73
-
74
-
75
-
76
-
77
-
78
-
79
-
80
-
81
-
82
-
83
-
84
-
85
-
86
-
87
-
88
-
 89
89 -
 90
90 -
 91
91 -
 92
92 -
 93
93 -
 94
94 -
 95
95 -
 96
96 -
 97
97 -
 98
98 -
 99
99 -
 100
100 -
 101
101 -
 102
102 -
 103
103 -
 104
104 -
 105
105 -
 106
106 -
 107
107 -
 108
108 -
 109
109 -
110
-
111
-
112
-
113
-
114
-
115
-
116
-
117
-
118
-
119
-
120
-
121
-
122
-
123
-
124
 |
 |

Humana Inc.
NOTES TO CONSOLIDATED FINANCIAL STATEMENTS—(Continued)
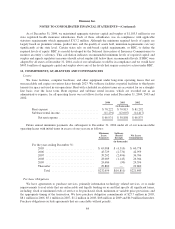
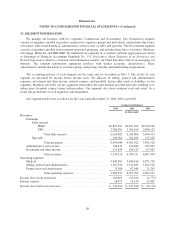
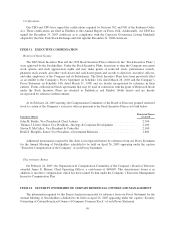
Government Segment
2004 2003 2002
(in thousands)
Revenues:
Premiums:
Medicare Advantage ................................. $3,086,598 $2,527,446 $2,629,597
TRICARE ......................................... 2,127,595 2,249,725 2,001,474
Medicaid .......................................... 511,193 487,100 462,998
Total premiums ................................. 5,725,386 5,264,271 5,094,069
Administrative services fees ............................... 106,764 148,830 141,193
Investment and other income .............................. 26,261 22,839 18,441
Total revenues .................................. 5,858,411 5,435,940 5,253,703
Operating expenses:
Medical ............................................... 4,825,064 4,439,007 4,266,404
Selling, general and administrative .......................... 710,522 726,185 708,853
Depreciation and amortization ............................. 44,488 43,831 49,487
Total operating expenses .......................... 5,580,074 5,209,023 5,024,744
Income from operations ...................................... 278,337 226,917 228,959
Interest expense ............................................. 4,497 3,211 3,851
Income before income taxes ................................... $ 273,840 $ 223,706 $ 225,108
Premium and administrative services revenues derived from our contracts with the federal government, as a
percentage of our total premium and ASO revenues, were approximately 43% for 2004, 42% for 2003 and 44%
for 2002.
16. REINSURANCE
Certain old blocks of run-off insurance assumed in acquisitions, primarily life insurance and annuities, are
subject to 100% coinsurance agreements where the underwriting risk and all administrative functions, including
premium collections and claim payments, related to these policies has been ceded to a third-party. Coinsurance is
a form of reinsurance. We acquired these policies and the related reinsurance agreements with the purchase of the
stock of the companies in which the policies were originally written. We acquired these companies for business
reasons unrelated to these policies, including the companies’ licenses necessary to fulfill strategic plans.
A reinsurance agreement between two entities transfers the underwriting risk of policyholder liabilities to a
reinsurer; while the primary insurer retains the contractual relationship with the ultimate insured. As such, these
reinsurance agreements do not completely relieve us of our potential liability to the ultimate insured. However,
given the transfer of underwriting risk, our potential liability is limited to the credit exposure which exists should
the reinsurer be unable to meet their obligations assumed under these reinsurance agreements.
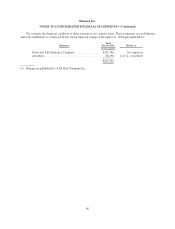
Given that all policies are 100% reinsured by third parties, the following amounts pertaining to the
reinsurance agreements had no effect on our results of operations. Premiums ceded were $30.0 million in 2004,
$45.3 million in 2003, and $59.3 million in 2002. Liabilities, included in “Other long-term liabilities,” and
related reinsurance recoverables, included in “Other long-term assets,” in the accompanying consolidated balance
sheets under these coinsurance agreements were $260.6 million at December 31, 2004 and $272.1 million at
December 31, 2003.
89