Humana 2004 Annual Report Download - page 33
Download and view the complete annual report
Please find page 33 of the 2004 Humana annual report below. You can navigate through the pages in the report by either clicking on the pages listed below, or by using the keyword search tool below to find specific information within the annual report.-
 1
1 -
2
-
3
-
4
-
5
-
6
-
7
-
8
-
9
-
10
-
11
-
12
-
13
-
14
-
15
-
16
-
17
-
18
-
19
-
20
-
21
-
22
-
 23
23 -
 24
24 -
 25
25 -
 26
26 -
 27
27 -
 28
28 -
 29
29 -
 30
30 -
 31
31 -
 32
32 -
 33
33 -
 34
34 -
 35
35 -
 36
36 -
 37
37 -
 38
38 -
 39
39 -
 40
40 -
 41
41 -
 42
42 -
 43
43 -
44
-
45
-
46
-
47
-
48
-
49
-
50
-
51
-
52
-
53
-
54
-
55
-
56
-
57
-
58
-
59
-
60
-
61
-
62
-
63
-
64
-
65
-
66
-
67
-
68
-
69
-
70
-
71
-
72
-
73
-
74
-
75
-
76
-
77
-
78
-
79
-
80
-
81
-
82
-
83
-
84
-
85
-
86
-
87
-
88
-
89
-
90
-
91
-
92
-
93
-
94
-
95
-
96
-
97
-
98
-
99
-
100
-
101
-
102
-
103
-
104
-
105
-
106
-
107
-
108
-
109
-
110
-
111
-
112
-
113
-
114
-
115
-
116
-
117
-
118
-
119
-
120
-
121
-
122
-
123
-
124
 |
 |

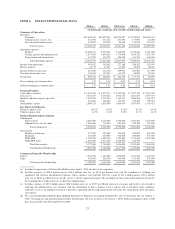
ITEM 6. SELECTED FINANCIAL DATA
2004(a) 2003(b) 2002(c)(d) 2001(d) 2000(d)
(in thousands, except per share results, membership and ratios)
Summary of Operations
Revenues:
Premiums ....................................... $12,689,432 $11,825,283 $10,930,397 $ 9,938,961 $10,394,631
Administrative services fees ........................ 272,796 271,676 244,396 137,090 86,298
Investment and other income ........................ 142,097 129,352 86,388 118,835 115,021
Total revenues ............................... 13,104,325 12,226,311 11,261,181 10,194,886 10,595,950
Operating expenses:
Medical ........................................ 10,669,647 9,879,421 9,138,196 8,279,844 8,781,998
Selling, general and administrative ................... 1,877,864 1,858,028 1,775,069 1,545,129 1,524,799
Depreciation and amortization ....................... 117,792 126,779 120,730 161,531 146,548
Total operating expenses ....................... 12,665,303 11,864,228 11,033,995 9,986,504 10,453,345
Income from operations ................................ 439,022 362,083 227,186 208,382 142,605
Interest expense ...................................... 23,172 17,367 17,252 25,302 28,615
Income before income taxes ............................ 415,850 344,716 209,934 183,080 113,990
Provision for income taxes .............................. 135,838 115,782 67,179 65,909 23,938
Net income .......................................... $ 280,012 $ 228,934 $ 142,755 $ 117,171 $ 90,052
Basic earnings per common share ........................ $ 1.75 $ 1.44 $ 0.87 $ 0.71 $ 0.54
Diluted earnings per common share ....................... $ 1.72 $ 1.41 $ 0.85 $ 0.70 $ 0.54
Financial Position
Cash and investments .................................. $ 3,074,189 $ 2,927,213 $ 2,415,914 $ 2,327,139 $ 2,312,399
Total assets .......................................... 5,657,617 5,379,814 4,956,754 4,681,693 4,597,533
Medical and other expenses payable ...................... 1,422,010 1,272,156 1,142,131 1,086,386 1,181,027
Debt ............................................... 636,696 642,638 604,913 578,489 599,952
Stockholders’ equity .................................. 2,090,124 1,835,949 1,606,474 1,507,949 1,360,421
Key Financial Indicators
Medical expense ratio ................................. 84.1% 83.5% 83.6% 83.3% 84.5%
SG&A expense ratio .................................. 14.5% 15.4% 15.9% 15.3% 14.5%
Medical Membership by Segment
Commercial:
Fully insured .................................... 2,286,500 2,352,800 2,340,300 2,301,300 2,545,800
Administrative services only ........................ 1,018,600 712,400 652,200 592,500 612,800
Total Commercial ............................ 3,305,100 3,065,200 2,992,500 2,893,800 3,158,600
Government:
Medicare Advantage .............................. 377,200 328,600 344,100 393,900 494,200
Medicaid ....................................... 478,600 468,900 506,000 490,800 575,600
TRICARE ...................................... 1,789,400 1,849,700 1,755,800 1,714,600 1,070,300
TRICARE ASO .................................. 1,082,400 1,057,200 1,048,700 942,700 —
Total Government ............................ 3,727,600 3,704,400 3,654,600 3,542,000 2,140,100
Total Medical Membership ..................... 7,032,700 6,769,600 6,647,100 6,435,800 5,298,700
Commercial Specialty Membership
Dental .............................................. 1,246,700 1,147,400 1,094,600 1,123,300 1,148,100
Other .............................................. 461,500 520,700 545,400 571,300 678,900
Total specialty membership ..................... 1,708,200 1,668,100 1,640,000 1,694,600 1,827,000
(a) Includes the operations of Ochsner Health Plan since April 1, 2004, the date of its acquisition.
(b) Includes expenses of $30.8 million pretax ($18.8 million after tax, or $0.12 per diluted share) for the writedown of building and
equipment and software abandonment expenses. These expenses were partially offset by a gain of $15.2 million pretax ($10.1 million
after tax, or $0.06 per diluted share) for the sale of a venture capital investment. The net impact of these items reduced pretax income by
$15.6 million ($8.7 million after tax, or $0.05 per diluted share).
(c) Includes expenses of $85.6 million pretax ($58.2 million after tax, or $0.35 per diluted share) for severance and facility costs related to
reducing our administrative cost structure with the elimination of three customer service centers and an enterprise-wide workforce
reduction, reserves for liabilities related to a previous acquisition and the impairment in the fair value of certain private debt and equity
investments.
(d) We ceased amortizing goodwill upon adopting Statement of Financial Accounting Standard No. 142, or Statement 142, on January 1,
2002. Assuming the non-amortization provisions of Statement 142 were in effect as of January 1, 2000, diluted earnings per share would
have increased $0.31 in 2001 and $0.30 in 2000.
23