Humana 2004 Annual Report Download - page 56
Download and view the complete annual report
Please find page 56 of the 2004 Humana annual report below. You can navigate through the pages in the report by either clicking on the pages listed below, or by using the keyword search tool below to find specific information within the annual report.-
 1
1 -
2
-
3
-
4
-
5
-
6
-
7
-
8
-
9
-
10
-
11
-
12
-
13
-
14
-
15
-
16
-
17
-
18
-
19
-
20
-
21
-
22
-
23
-
24
-
25
-
26
-
27
-
28
-
29
-
30
-
31
-
32
-
33
-
34
-
35
-
36
-
37
-
38
-
39
-
40
-
41
-
42
-
43
-
44
-
45
-
 46
46 -
 47
47 -
 48
48 -
 49
49 -
 50
50 -
 51
51 -
 52
52 -
 53
53 -
 54
54 -
 55
55 -
 56
56 -
 57
57 -
 58
58 -
 59
59 -
 60
60 -
 61
61 -
 62
62 -
 63
63 -
 64
64 -
 65
65 -
 66
66 -
67
-
68
-
69
-
70
-
71
-
72
-
73
-
74
-
75
-
76
-
77
-
78
-
79
-
80
-
81
-
82
-
83
-
84
-
85
-
86
-
87
-
88
-
89
-
90
-
91
-
92
-
93
-
94
-
95
-
96
-
97
-
98
-
99
-
100
-
101
-
102
-
103
-
104
-
105
-
106
-
107
-
108
-
109
-
110
-
111
-
112
-
113
-
114
-
115
-
116
-
117
-
118
-
119
-
120
-
121
-
122
-
123
-
124
 |
 |

the impact of the items for which the federal government retains risk, including the risks associated with changes
in usage levels at military treatment facilities, or MTFs, change in the number of persons eligible for TRICARE
benefits, and medical unit cost inflation. We work closely with the federal government to obtain and review
eligibility and MTF workload data, and to quantify and negotiate amounts recoverable or payable under our
contractual BPA requirements. Final settlement of BPAs occurs only at specified intervals, typically in excess of
6 months after the end of a contract year. We record revenues applicable to BPAs when these amounts are
determinable and collectibility is reasonably assured.
Investment Securities
Investment securities totaled $2,494.1 million, or 44% of total assets at December 31, 2004. Debt securities
totaled $2,452.0 million, or 98% of our total investment portfolio. More than 94% of our debt securities were of
investment-grade quality, with an average credit rating of AA+ by Standard & Poor’s at December 31, 2004.
Most of the debt securities that are below investment grade are rated at the higher end (BB or better) of the non-
investment grade spectrum. Our investment policy limits investments in a single issuer and requires
diversification among various asset types.
Duration is indicative of the relationship between changes in market value and changes in interest rates,
providing a general indication of the sensitivity of the fair values of our debt securities to changes in interest
rates. However, actual market values may differ significantly from estimates based on duration. The average
duration of our debt securities was approximately 3.3 years at December 31, 2004. Based on this duration, a 1%
increase in interest rates would generally decrease the fair value of our debt securities by approximately $80
million.
Our investment securities are categorized as available for sale and, as a result, are stated at fair value. Fair
value of publicly traded debt and equity securities are based on quoted market prices. Non-traded debt securities
are priced independently by a third party vendor. Fair value of venture capital debt securities that are privately
held, or where an observable quoted market price does not exist, are estimated using a variety of valuation
methodologies. Such methodologies include reviewing the value ascribed to the most recent financing,
comparing the security with securities of publicly traded companies in a similar line of business, and reviewing
the underlying financial performance including estimating discounted cash flows. Unrealized holding gains and
losses, net of applicable deferred taxes, are included as a component of stockholders’ equity until realized from a
sale or impairment.
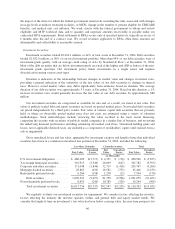
Gross unrealized losses and fair value, aggregated by investment category and length of time that individual
securities have been in a continuous unrealized loss position at December 31, 2004, included the following:
Less than 12 months 12 months or more Total
Fair Value
Unrealized
Losses
Fair
Value
Unrealized
Losses Fair Value
Unrealized
Losses
(in thousands)
U.S. Government obligations ........ $ 486,209 $(3,717) $ 4,351 $ (136) $ 490,560 $ (3,853)
Tax exempt municipal securities ...... 316,913 (3,346) 26,869 (647) 343,782 (3,993)
Corporate and other securities ........ 171,048 (1,846) 32,719 (1,418) 203,767 (3,264)
Mortgage-backed securities .......... 28,865 (430) 16,581 (753) 45,446 (1,183)
Redeemable preferred stocks ......... 6,266 (158) 1,238 (12) 7,504 (170)
Debt securities ................ 1,009,301 (9,497) 81,758 (2,966) 1,091,059 (12,463)
Non-redeemable preferred stocks ..... 8,455 (240) 10,789 (329) 19,244 (569)
Total investment securities ...... $1,017,756 $(9,737) $92,547 $(3,295) $1,110,303 $(13,032)
We regularly evaluate our investment securities for impairment. We consider factors affecting the investee,
factors affecting the industry the investee operates within, and general debt and equity market trends. We
consider the length of time an investment’s fair value has been below carrying value, the near term prospects for
46