Humana 2004 Annual Report Download - page 21
Download and view the complete annual report
Please find page 21 of the 2004 Humana annual report below. You can navigate through the pages in the report by either clicking on the pages listed below, or by using the keyword search tool below to find specific information within the annual report.-
 1
1 -
2
-
3
-
4
-
5
-
6
-
7
-
8
-
9
-
10
-
 11
11 -
 12
12 -
 13
13 -
 14
14 -
 15
15 -
 16
16 -
 17
17 -
 18
18 -
 19
19 -
 20
20 -
 21
21 -
 22
22 -
 23
23 -
 24
24 -
 25
25 -
 26
26 -
 27
27 -
 28
28 -
 29
29 -
 30
30 -
 31
31 -
32
-
33
-
34
-
35
-
36
-
37
-
38
-
39
-
40
-
41
-
42
-
43
-
44
-
45
-
46
-
47
-
48
-
49
-
50
-
51
-
52
-
53
-
54
-
55
-
56
-
57
-
58
-
59
-
60
-
61
-
62
-
63
-
64
-
65
-
66
-
67
-
68
-
69
-
70
-
71
-
72
-
73
-
74
-
75
-
76
-
77
-
78
-
79
-
80
-
81
-
82
-
83
-
84
-
85
-
86
-
87
-
88
-
89
-
90
-
91
-
92
-
93
-
94
-
95
-
96
-
97
-
98
-
99
-
100
-
101
-
102
-
103
-
104
-
105
-
106
-
107
-
108
-
109
-
110
-
111
-
112
-
113
-
114
-
115
-
116
-
117
-
118
-
119
-
120
-
121
-
122
-
123
-
124
 |
 |

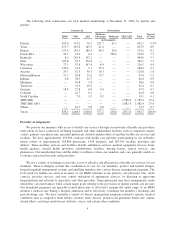
Medical membership under these various arrangements was as follows at December 31, 2004 and 2003:
Commercial Segment Government Segment Consol.
Total
Medical
Fully
Insured ASO
Total
Segment
Medicare
Advantage Medicaid TRICARE
TRICARE
ASO
Total
Segment
Medical Membership:
December 31, 2004
Capitated HMO hospital
system based ........ 70,300 — 70,300 38,400 17,400 — — 55,800 126,100
Capitated HMO physician
group based ......... 56,300 — 56,300 4,200 188,200 — — 192,400 248,700
Risk-sharing .......... 68,000 — 68,000 208,300 240,700 — — 449,000 517,000
Other ................ 2,091,900 1,018,600 3,110,500 126,300 32,300 1,789,400 1,082,400 3,030,400 6,140,900
Total ............ 2,286,500 1,018,600 3,305,100 377,200 478,600 1,789,400 1,082,400 3,727,600 7,032,700
December 31, 2003
Capitated HMO hospital
system based ........ 128,000 — 128,000 38,800 13,600 — — 52,400 180,400
Capitated HMO physician
group based ......... 71,700 — 71,700 5,900 220,000 — — 225,900 297,600
Risk-sharing .......... 68,000 — 68,000 157,500 204,800 — — 362,300 430,300
Other ................ 2,085,100 712,400 2,797,500 126,400 30,500 1,849,700 1,057,200 3,063,800 5,861,300
Total ............ 2,352,800 712,400 3,065,200 328,600 468,900 1,849,700 1,057,200 3,704,400 6,769,600
Medical Membership Distribution:
December 31, 2004
Capitated HMO hospital
system based ........ 3.1% — 2.1% 10.2% 3.6% — — 1.5% 1.8%
Capitated HMO physician
group based ......... 2.5% — 1.7% 1.1% 39.3% — — 5.2% 3.5%
Risk-sharing .......... 3.0% — 2.1% 55.2% 50.4% — — 12.0% 7.4%
All other membership . . . 91.4% 100.0% 94.1% 33.5% 6.7% 100.0% 100.0% 81.3% 87.3%
Total ............ 100.0% 100.0% 100.0% 100.0% 100.0% 100.0% 100.0% 100.0% 100.0%
December 31, 2003
Capitated HMO hospital
system based ........ 5.4% — 4.2% 11.8% 2.9% — — 1.4% 2.7%
Capitated HMO physician
group based ......... 3.0% — 2.3% 1.8% 46.9% — — 6.1% 4.4%
Risk-sharing .......... 2.9% — 2.2% 47.9% 43.7% — — 9.8% 6.4%
All other membership . . . 88.7% 100.0% 91.3% 38.5% 6.5% 100.0% 100.0% 82.7% 86.5%
Total ............ 100.0% 100.0% 100.0% 100.0% 100.0% 100.0% 100.0% 100.0% 100.0%
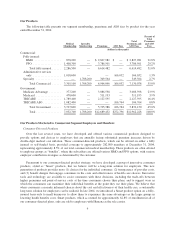
Capitation expense as a percentage of total medical expense was as follows for the years ended December
31, 2004, 2003 and 2002:
2004 2003 2002
(dollars in thousands)
Medical Expenses:
Capitated HMO expense ............... $ 465,231 4.4% $ 597,244 6.0% $ 603,617 6.6%
Other medical expense ................ 10,204,416 95.6% 9,282,177 94.0% 8,534,579 93.4%
Consolidated medical expense ...... $10,669,647 100.0% $9,879,421 100.0% $9,138,196 100.0%
Accreditation Assessment
Our accreditation assessment program consists of several internal programs such as those that credential
providers and those designed to meet the audit standards of federal and state agencies as well as external
accreditation standards. We also offer quality and outcome measurement and improvement programs such as the
11