Humana 2004 Annual Report Download - page 43
Download and view the complete annual report
Please find page 43 of the 2004 Humana annual report below. You can navigate through the pages in the report by either clicking on the pages listed below, or by using the keyword search tool below to find specific information within the annual report.-
 1
1 -
2
-
3
-
4
-
5
-
6
-
7
-
8
-
9
-
10
-
11
-
12
-
13
-
14
-
15
-
16
-
17
-
18
-
19
-
20
-
21
-
22
-
23
-
24
-
25
-
26
-
27
-
28
-
29
-
30
-
31
-
32
-
 33
33 -
 34
34 -
 35
35 -
 36
36 -
 37
37 -
 38
38 -
 39
39 -
 40
40 -
 41
41 -
 42
42 -
 43
43 -
 44
44 -
 45
45 -
 46
46 -
 47
47 -
 48
48 -
 49
49 -
 50
50 -
 51
51 -
 52
52 -
 53
53 -
54
-
55
-
56
-
57
-
58
-
59
-
60
-
61
-
62
-
63
-
64
-
65
-
66
-
67
-
68
-
69
-
70
-
71
-
72
-
73
-
74
-
75
-
76
-
77
-
78
-
79
-
80
-
81
-
82
-
83
-
84
-
85
-
86
-
87
-
88
-
89
-
90
-
91
-
92
-
93
-
94
-
95
-
96
-
97
-
98
-
99
-
100
-
101
-
102
-
103
-
104
-
105
-
106
-
107
-
108
-
109
-
110
-
111
-
112
-
113
-
114
-
115
-
116
-
117
-
118
-
119
-
120
-
121
-
122
-
123
-
124
 |
 |
Summary
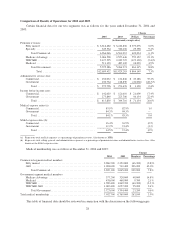
Net income was $228.9 million, or $1.41 per diluted share, in 2003 compared to net income of $142.8
million, or $0.85 per diluted share, in 2002. The increase in earnings resulted primarily from significant
improvement in operating earnings for the Commercial segment and a decrease in expenses for asset
impairments and other unusual items.
Premium Revenues and Medical Membership
Premium revenues increased 8.2%, to $11.8 billion, for 2003 compared to $10.9 billion for 2002. Higher
premium revenues resulted primarily from increases in fully insured commercial premium rates and an increase
in TRICARE premiums. Items impacting premium rates include changes in premium and government
reimbursement rates, as well as changes in the geographic mix of membership, the mix of product offerings, and
the mix of benefit plans selected by our membership.
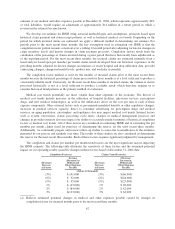
Commercial segment premium revenues increased 12.4%, to $6.6 billion, for 2003 compared to $5.8 billion
for 2002. This improvement resulted primarily from increases in per member premiums in the 12% to 14% range
for 2003 on our fully insured commercial business. Additionally, our fully insured commercial medical
membership increased 0.5% or 12,500 members, to 2,352,800 at December 31, 2003 compared to 2,340,300 at
December 31, 2002.
Government segment premium revenues increased 3.3%, to $5.3 billion, for 2003 compared to $5.1 billion
for 2002. This increase primarily was attributable to our TRICARE business, partially offset by a reduction in our
Medicare Advantage membership. Rates were increased upon annual renewal of our base TRICARE contract and
led to an increase in TRICARE premium revenues of $248.3 million, or 12.4%, compared to 2002. Medicare
Advantage membership was 328,600 at December 31, 2003 compared to 344,100 at December 31, 2002, a
decline of 15,500 members, or 4.5%. This decline resulted as we exited several counties in some of our markets
effective January 1, 2003 and general attrition in certain markets as a result of annual changes to benefit designs.
Per member Medicare premiums increased in the 4% to 6% range for 2003.
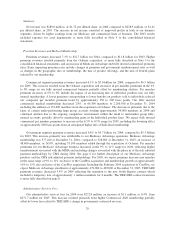
Administrative Services Fees
Administrative services fees for 2003 were $271.7 million, an increase of $27.3 million from $244.4 million
for 2002. For the Commercial segment, administrative services fees increased $19.6 million, or 19.0%, to $122.8
million. This increase corresponds to the higher level of ASO membership at December 31, 2003, which was
712,400 members, compared to 652,200 members at December 31, 2002 and also reflects an increase in the
average fees received per member. Administrative services fees for the Government segment increased $7.6
million when comparing 2003 to 2002. This increase resulted from contractual adjustments related to TRICARE
for Life, a program for seniors in which we provided medical benefit administrative services.
Investment and Other Income
Investment and other income totaled $129.4 million in 2003, an increase of $43.0 million from $86.4
million in 2002. This increase resulted primarily from an increase in net realized capital gains due to a $15.2
million gain from the sale of privately held venture capital investments and lower investment impairment losses,
a result of an improving market. We recorded investment impairment losses of $3.2 million in 2003 compared to
$27.2 million in 2002. Higher average invested balances offset lower interest rates. The average yield on
investment securities was 3.5% in 2003, declining from 4.6% in 2002.
Medical Expense
The consolidated MER for 2003 was 83.5%, decreasing 10 basis points from 83.6% for 2002.
The Commercial segment MER for 2003 was 82.9%, decreasing 60 basis points from 83.5% for 2002. The
improvement in the MER primarily resulted from per member premium rate increases in excess of medical cost
trends for our large group customers and the attrition of groups with higher medical expense ratios.
The Government segment medical expense ratio for 2003 was 84.3%, increasing 50 basis points from 83.8%
for 2002. This increase primarily was attributable to TRICARE as a result of having a higher level of revenues
from bid price adjustment activity in 2002.
33