Humana 2004 Annual Report Download - page 39
Download and view the complete annual report
Please find page 39 of the 2004 Humana annual report below. You can navigate through the pages in the report by either clicking on the pages listed below, or by using the keyword search tool below to find specific information within the annual report.-
 1
1 -
2
-
3
-
4
-
5
-
6
-
7
-
8
-
9
-
10
-
11
-
12
-
13
-
14
-
15
-
16
-
17
-
18
-
19
-
20
-
21
-
22
-
23
-
24
-
25
-
26
-
27
-
28
-
 29
29 -
 30
30 -
 31
31 -
 32
32 -
 33
33 -
 34
34 -
 35
35 -
 36
36 -
 37
37 -
 38
38 -
 39
39 -
 40
40 -
 41
41 -
 42
42 -
 43
43 -
 44
44 -
 45
45 -
 46
46 -
 47
47 -
 48
48 -
 49
49 -
50
-
51
-
52
-
53
-
54
-
55
-
56
-
57
-
58
-
59
-
60
-
61
-
62
-
63
-
64
-
65
-
66
-
67
-
68
-
69
-
70
-
71
-
72
-
73
-
74
-
75
-
76
-
77
-
78
-
79
-
80
-
81
-
82
-
83
-
84
-
85
-
86
-
87
-
88
-
89
-
90
-
91
-
92
-
93
-
94
-
95
-
96
-
97
-
98
-
99
-
100
-
101
-
102
-
103
-
104
-
105
-
106
-
107
-
108
-
109
-
110
-
111
-
112
-
113
-
114
-
115
-
116
-
117
-
118
-
119
-
120
-
121
-
122
-
123
-
124
 |
 |
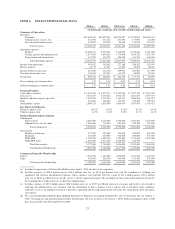
Summary
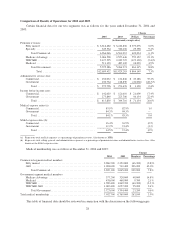
Net income was $280.0 million, or $1.72 per diluted share, in 2004 compared to $228.9 million, or $1.41
per diluted share, in 2003. The increase in net income consisted of improved profits in both of our business
segments, driven by higher earnings from our Medicare and commercial lines of business. The 2003 results
included expenses for asset impairments as more fully described in Note 5 to the consolidated financial
statements.
Premium Revenues and Medical Membership
Premium revenues increased 7.3% to $12.7 billion for 2004, compared to $11.8 billion for 2003. Higher
premium revenues resulted primarily from the Ochsner acquisition, as more fully described in Note 3 to the
consolidated financial statements, and an increase in Medicare Advantage and fully insured commercial premium
rates. Items impacting premium rates include changes in premium and government reimbursement rates as well
as changes in the geographic mix of membership, the mix of product offerings, and the mix of benefit plans
selected by our membership.
Commercial segment premium revenues increased 6.1% to $7.0 billion for 2004, compared to $6.5 billion
for 2003. This increase resulted from the Ochsner acquisition and increases in per member premiums in the 6%
to 8% range on our fully insured commercial business partially offset by membership attrition. Per member
premium increases of 6% to 8% include the impact of an increasing mix of individual products into our fully
insured membership. A lower premium corresponding to lower benefits on products sold to individuals reduced
our composite per member premium trend by approximately 150 to 200 basis points. Our fully insured
commercial medical membership decreased 2.8%, or 66,300 members, to 2,286,500 at December 31, 2004
including the addition of 152,600 members from the acquisition of Ochsner. The decrease is primarily due to the
lapse of certain under-performing large group accounts totaling approximately 94,000 members in 2004 and
continued attrition due to the ongoing competitive environment within the small to mid-market group fully-
insured accounts, partially offset by membership gains in the Individual product lines. We expect fully insured
commercial per member premiums to increase in the 6.5% to 8.5% range for 2005, including the lowering effect
of approximately 200 basis points from an anticipated higher mix of Individual membership.
Government segment premium revenues increased 8.8% to $5.7 billion for 2004, compared to $5.3 billion
for 2003. This increase primarily was attributable to our Medicare Advantage operations. Medicare Advantage
membership was 377,200 at December 31, 2004, compared to 328,600 at December 31, 2003, an increase of
48,600 members, or 14.8%, including 33,100 members added through the acquisition of Ochsner. Per member
premiums for our Medicare Advantage business increased in the 9% to 11% range for 2004, reflecting higher
reimbursement associated with the MMA and including changes associated with the phase in of the risk adjusted
payment methodology by CMS during 2004. See page 6 for further description of our Medicare Advantage
products and the CMS risk adjusted payment methodology. For 2005, we expect premium increases per member
in the same range of 9% to 11% exclusive of the CarePlus acquisition and membership growth of approximately
10% to 15% also exclusive of the CarePlus acquisition. Including the February 2005 acquisition of CarePlus, we
expect Medicare Advantage enrollment of approximately 470,000 to 485,000 at December 31, 2005. TRICARE
premium revenues decreased 5.4% in 2004 reflecting the transition to the new South Region contract which
included a temporary loss of approximately 1 million members for 4 months. The TRICARE contract transition
is more fully described on page 8.
Administrative Services Fees
Our administrative services fees for 2004 were $272.8 million, an increase of $1.1 million, or 0.4%, from
$271.7 million for 2003. This increase resulted primarily from higher Commercial ASO membership partially
offset by lower fees related to TRICARE’s change in government-contracted services.
29