Humana 2004 Annual Report Download - page 84
Download and view the complete annual report
Please find page 84 of the 2004 Humana annual report below. You can navigate through the pages in the report by either clicking on the pages listed below, or by using the keyword search tool below to find specific information within the annual report.-
 1
1 -
2
-
3
-
4
-
5
-
6
-
7
-
8
-
9
-
10
-
11
-
12
-
13
-
14
-
15
-
16
-
17
-
18
-
19
-
20
-
21
-
22
-
23
-
24
-
25
-
26
-
27
-
28
-
29
-
30
-
31
-
32
-
33
-
34
-
35
-
36
-
37
-
38
-
39
-
40
-
41
-
42
-
43
-
44
-
45
-
46
-
47
-
48
-
49
-
50
-
51
-
52
-
53
-
54
-
55
-
56
-
57
-
58
-
59
-
60
-
61
-
62
-
63
-
64
-
65
-
66
-
67
-
68
-
69
-
70
-
71
-
72
-
73
-
 74
74 -
 75
75 -
 76
76 -
 77
77 -
 78
78 -
 79
79 -
 80
80 -
 81
81 -
 82
82 -
 83
83 -
 84
84 -
 85
85 -
 86
86 -
 87
87 -
 88
88 -
 89
89 -
 90
90 -
 91
91 -
 92
92 -
 93
93 -
 94
94 -
95
-
96
-
97
-
98
-
99
-
100
-
101
-
102
-
103
-
104
-
105
-
106
-
107
-
108
-
109
-
110
-
111
-
112
-
113
-
114
-
115
-
116
-
117
-
118
-
119
-
120
-
121
-
122
-
123
-
124
 |
 |

Humana Inc.
NOTES TO CONSOLIDATED FINANCIAL STATEMENTS—(Continued)
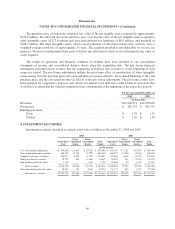
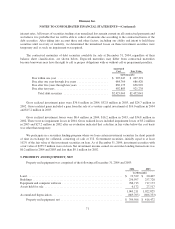
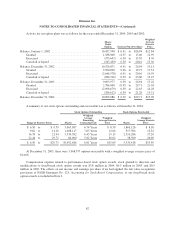
The following table presents details of our other intangible assets included in other non-current assets in the
accompanying consolidated balance sheets at December 31, 2004 and December 31, 2003:
Weighted
Average
Life
2004 2003
Cost
Accumulated
Amortization Net Cost
Accumulated
Amortization Net
(in thousands)
Other intangible assets:
Subscriber contracts ........... 9.7yrs $ 97,256 $82,343 $14,913 $ 85,496 $75,194 $10,302
Provider contracts ............ 9.6yrs 22,428 11,022 11,406 12,128 8,075 4,053
Government contracts ......... — — — — 11,820 11,820 —
Licenses and other ............ 23.7 yrs 5,790 1,787 4,003 5,065 1,376 3,689
Total other intangible
assets ................ 10.3 yrs $125,474 $95,152 $30,322 $114,509 $96,465 $18,044
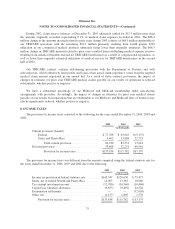
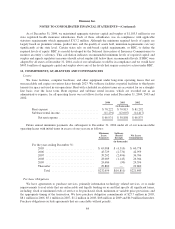
7. MEDICAL AND OTHER EXPENSES PAYABLE
Activity in medical and other expenses payable was as follows for the years ended December 31, 2004,
2003 and 2002:
2004 2003 2002
(in thousands)
Balances at January 1 .................. $ 1,272,156 $ 1,142,131 $ 1,086,386
Acquisitions .......................... 71,063 — —
Incurred related to:
Current year ...................... 10,763,105 9,955,491 9,125,915
Prior years ....................... (93,458) (76,070) 12,281
Total incurred ................ 10,669,647 9,879,421 9,138,196
Paid related to:
Current year ...................... (9,504,331) (8,710,393) (8,002,610)
Prior years ....................... (1,086,525) (1,039,003) (1,079,841)
Total paid .................... (10,590,856) (9,749,396) (9,082,451)
Balances at December 31 ............... $ 1,422,010 $ 1,272,156 $ 1,142,131
Amounts incurred related to prior years vary from previously estimated liabilities as the claims ultimately
are settled. Negative amounts reported for incurred related to prior years result from claims being ultimately
settled for amounts less than originally estimated (favorable development). Positive amounts reported for
incurred related to prior years result from claims ultimately being settled for amounts greater than originally
estimated (unfavorable development).
As summarized in the previous table, claim reserve balances at December 31, 2003 ultimately settled during
2004 for $93.5 million less than the amounts originally estimated, representing 0.9% of medical claim expenses
incurred in 2003. During 2003, claim reserve balances at December 31, 2002 ultimately settled for $76.1 million
less than the amounts originally estimated, representing 0.8% of medical claim expenses recorded in 2002. This
$17.4 million change in the amounts incurred related to prior years resulted primarily from favorable
development in our Medicare line of business as a result of better than expected utilization in the latter half of
2003. The substantial majority of this favorable development in the Medicare business occurred under risk-
sharing arrangements with providers, which resulted in minimizing the impact on our reported 2004 results from
operations.
74