Humana 2004 Annual Report Download - page 80
Download and view the complete annual report
Please find page 80 of the 2004 Humana annual report below. You can navigate through the pages in the report by either clicking on the pages listed below, or by using the keyword search tool below to find specific information within the annual report.-
 1
1 -
2
-
3
-
4
-
5
-
6
-
7
-
8
-
9
-
10
-
11
-
12
-
13
-
14
-
15
-
16
-
17
-
18
-
19
-
20
-
21
-
22
-
23
-
24
-
25
-
26
-
27
-
28
-
29
-
30
-
31
-
32
-
33
-
34
-
35
-
36
-
37
-
38
-
39
-
40
-
41
-
42
-
43
-
44
-
45
-
46
-
47
-
48
-
49
-
50
-
51
-
52
-
53
-
54
-
55
-
56
-
57
-
58
-
59
-
60
-
61
-
62
-
63
-
64
-
65
-
66
-
67
-
68
-
69
-
 70
70 -
 71
71 -
 72
72 -
 73
73 -
 74
74 -
 75
75 -
 76
76 -
 77
77 -
 78
78 -
 79
79 -
 80
80 -
 81
81 -
 82
82 -
 83
83 -
 84
84 -
 85
85 -
 86
86 -
 87
87 -
 88
88 -
 89
89 -
 90
90 -
91
-
92
-
93
-
94
-
95
-
96
-
97
-
98
-
99
-
100
-
101
-
102
-
103
-
104
-
105
-
106
-
107
-
108
-
109
-
110
-
111
-
112
-
113
-
114
-
115
-
116
-
117
-
118
-
119
-
120
-
121
-
122
-
123
-
124
 |
 |

Humana Inc.
NOTES TO CONSOLIDATED FINANCIAL STATEMENTS—(Continued)
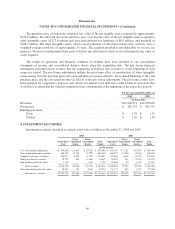
Investment securities classified as long-term assets were as follows at December 31, 2004 and 2003:
2004 2003
Amortized
Cost
Gross
Unrealized
Gains
Gross
Unrealized
Losses
Fair
Value
Amortized
Cost
Gross
Unrealized
Gains
Gross
Unrealized
Losses
Fair
Value
(in thousands)
U.S. Government obligations .......... $146,221 $ 514 $ (901) $145,834 $137,512 $ 1,532 $(101) $138,943
Tax exempt municipal securities ....... 69,529 686 (271) 69,944 65,535 1,014 (294) 66,255
Corporate and other securities ......... 69,514 1,077 (143) 70,448 57,994 1,365 (271) 59,088
Mortgage-backed securities ........... 14,258 143 (37) 14,364 11,155 116 (44) 11,227
Redeemable preferred stocks .......... 31,348 12,767 (36) 44,079 32,625 7,390 — 40,015
Debt securities ................. 330,870 15,187 (1,388) 344,669 304,821 11,417 (710) 315,528
Non-redeemable preferred stocks ...... 2,491 24 — 2,515 2,233 19 (13) 2,239
Common stocks .................... 1,281 — — 1,281 1,400 — — 1,400
Equity securities ................ 3,772 24 — 3,796 3,633 19 (13) 3,639
Long-term investment securities . . . $334,642 $15,211 $(1,388) $348,465 $308,454 $11,436 $(723) $319,167
Investment securities with a fair value of $95.4 million at December 31, 2004 and at December 31, 2003
were on deposit at financial institutions in certain states pursuant to the respective states’ insurance regulations.
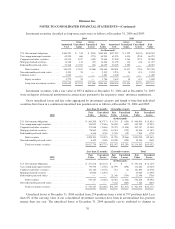
Gross unrealized losses and fair value aggregated by investment category and length of time that individual
securities have been in a continuous unrealized loss position were as follows at December 31, 2004 and 2003:
Less than 12 months 12 months or more Total
2004
Fair
Value
Unrealized
Losses
Fair
Value
Unrealized
Losses
Fair
Value
Unrealized
Losses
(in thousands)
U.S. Government obligations .............................. $ 486,209 $(3,717) $ 4,351 $ (136) $ 490,560 $ (3,853)
Tax exempt municipal securities ............................ 316,913 (3,346) 26,869 (647) 343,782 (3,993)
Corporate and other securities .............................. 171,048 (1,846) 32,719 (1,418) 203,767 (3,264)
Mortgage-backed securities ............................... 28,865 (430) 16,581 (753) 45,446 (1,183)
Redeemable preferred stocks .............................. 6,266 (158) 1,238 (12) 7,504 (170)
Debt securities ...................................... 1,009,301 (9,497) 81,758 (2,966) 1,091,059 (12,463)
Non-redeemable preferred stocks ........................... 8,455 (240) 10,789 (329) 19,244 (569)
Total investment securities ............................ $1,017,756 $(9,737) $92,547 $(3,295) $1,110,303 $(13,032)
Less than 12 months 12 months or more Total
2003
Fair
Value
Unrealized
Losses
Fair
Value
Unrealized
Losses
Fair
Value
Unrealized
Losses
(in thousands)
U.S. Government obligations .............................. $ 251,218 $(2,125) $ — $ — $ 251,218 $ (2,125)
Tax exempt municipal securities ............................ 90,705 (1,566) 21,979 (494) 112,684 (2,060)
Corporate and other securities .............................. 121,184 (3,674) 714 (4) 121,898 (3,678)
Mortgage-backed securities ............................... 47,060 (1,295) — — 47,060 (1,295)
Redeemable preferred stocks .............................. — — 21,348 (734) 21,348 (734)
Debt securities ...................................... 510,167 (8,660) 44,041 (1,232) 554,208 (9,892)
Non-redeemable preferred stocks ........................... — — 7,162 (285) 7,162 (285)
Total investment securities ............................ $ 510,167 $(8,660) $51,203 $(1,517) $ 561,370 $(10,177)
Unrealized losses at December 31, 2004 resulted from 254 positions from a total of 797 positions held. Less
than 4% of the carrying value of our consolidated investment securities have been in an unrealized loss position
greater than one year. The unrealized losses at December 31, 2004 generally can be attributed to changes in
70