Humana 2004 Annual Report Download - page 79
Download and view the complete annual report
Please find page 79 of the 2004 Humana annual report below. You can navigate through the pages in the report by either clicking on the pages listed below, or by using the keyword search tool below to find specific information within the annual report.-
 1
1 -
2
-
3
-
4
-
5
-
6
-
7
-
8
-
9
-
10
-
11
-
12
-
13
-
14
-
15
-
16
-
17
-
18
-
19
-
20
-
21
-
22
-
23
-
24
-
25
-
26
-
27
-
28
-
29
-
30
-
31
-
32
-
33
-
34
-
35
-
36
-
37
-
38
-
39
-
40
-
41
-
42
-
43
-
44
-
45
-
46
-
47
-
48
-
49
-
50
-
51
-
52
-
53
-
54
-
55
-
56
-
57
-
58
-
59
-
60
-
61
-
62
-
63
-
64
-
65
-
66
-
67
-
68
-
 69
69 -
 70
70 -
 71
71 -
 72
72 -
 73
73 -
 74
74 -
 75
75 -
 76
76 -
 77
77 -
 78
78 -
 79
79 -
 80
80 -
 81
81 -
 82
82 -
 83
83 -
 84
84 -
 85
85 -
 86
86 -
 87
87 -
 88
88 -
 89
89 -
90
-
91
-
92
-
93
-
94
-
95
-
96
-
97
-
98
-
99
-
100
-
101
-
102
-
103
-
104
-
105
-
106
-
107
-
108
-
109
-
110
-
111
-
112
-
113
-
114
-
115
-
116
-
117
-
118
-
119
-
120
-
121
-
122
-
123
-
124
 |
 |

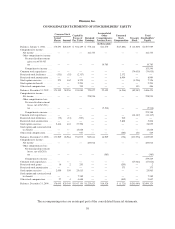
Humana Inc.
NOTES TO CONSOLIDATED FINANCIAL STATEMENTS—(Continued)
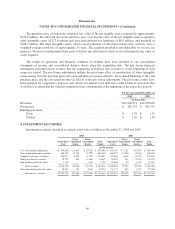
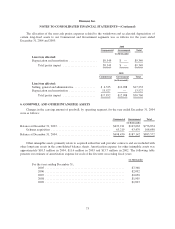
The purchase price exceeded the estimated fair value of the net tangible assets acquired by approximately
$122.6 million. We allocated the excess purchase price over the fair value of the net tangible assets acquired to
other intangible assets of $22.8 million and associated deferred tax liabilities of $8.9 million, and goodwill of
$108.7 million. The other intangible assets, which consist primarily of subscriber and provider contracts, have a
weighted-average useful life of approximately 13 years. The acquired goodwill is not deductible for income tax
purposes. We used an independent third party valuation specialist firm to assist us in evaluating the fair value of
assets acquired.
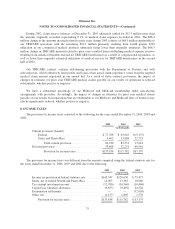
The results of operations and financial condition of Ochsner have been included in our consolidated
statements of income and consolidated balance sheets since the acquisition date. The pro forma financial
information presented below assumes that the acquisition of Ochsner had occurred as of the beginning of each
respective period. The pro forma adjustments include the pro forma effect of amortization of other intangible
assets arising from the purchase price allocation and interest expense related to the assumed financing of the cash
purchase price and the associated income tax effects of the pro forma adjustments. The pro forma results have
been prepared for comparative purposes only and do not purport to be indicative of the results of operations that
would have occurred had the Ochsner acquisition been consummated at the beginning of the respective periods.
For the year ended December 31,
2004 2003
(in thousands)
Revenues ........................................................... $13,290,331 $12,930,078
Net income ......................................................... $ 285,753 $ 242,553
Earnings per share:
Basic .......................................................... $ 1.78 $ 1.53
Diluted ......................................................... $ 1.76 $ 1.50
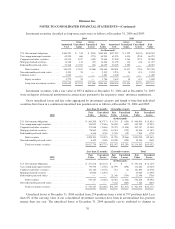
4. INVESTMENT SECURITIES
Investment securities classified as current assets were as follows at December 31, 2004 and 2003:
2004 2003
Amortized
Cost
Gross
Unrealized
Gains
Gross
Unrealized
Losses
Fair
Value
Amortized
Cost
Gross
Unrealized
Gains
Gross
Unrealized
Losses
Fair
Value
(in thousands)
U.S. Government obligations ....... $ 650,200 $ 3,437 $ (2,952) $ 650,685 $ 455,305 $ 2,121 $(2,024) $ 455,402
Tax exempt municipal securities .... 888,592 11,379 (3,722) 896,249 686,552 14,056 (1,766) 698,842
Corporate and other securities ...... 469,375 8,593 (3,121) 474,847 374,568 8,649 (3,407) 379,810
Mortgage-backed securities ........ 78,722 839 (1,146) 78,415 84,399 811 (1,251) 83,959
Redeemable preferred stocks ....... 7,310 — (134) 7,176 27,686 95 (734) 27,047
Debt securities .............. 2,094,199 24,248 (11,075) 2,107,372 1,628,510 25,732 (9,182) 1,645,060
Non-redeemable preferred stocks . . . 38,221 621 (569) 38,273 31,171 683 (272) 31,582
Investment securities ......... $2,132,420 $24,869 $(11,644) $2,145,645 $1,659,681 $26,415 $(9,454) $1,676,642
69