Sony 2006 Annual Report Download - page 100
Download and view the complete annual report
Please find page 100 of the 2006 Sony annual report below. You can navigate through the pages in the report by either clicking on the pages listed below, or by using the keyword search tool below to find specific information within the annual report.-
 1
1 -
2
-
3
-
4
-
5
-
6
-
7
-
8
-
9
-
10
-
11
-
12
-
13
-
14
-
15
-
16
-
17
-
18
-
19
-
20
-
21
-
22
-
23
-
24
-
25
-
26
-
27
-
28
-
29
-
30
-
31
-
32
-
33
-
34
-
35
-
36
-
37
-
38
-
39
-
40
-
41
-
42
-
43
-
44
-
45
-
46
-
47
-
48
-
49
-
50
-
51
-
52
-
53
-
54
-
55
-
56
-
57
-
58
-
59
-
60
-
61
-
62
-
63
-
64
-
65
-
66
-
67
-
68
-
69
-
70
-
71
-
72
-
73
-
74
-
75
-
76
-
77
-
78
-
79
-
80
-
81
-
82
-
83
-
84
-
85
-
86
-
87
-
88
-
89
-
 90
90 -
 91
91 -
 92
92 -
 93
93 -
 94
94 -
 95
95 -
 96
96 -
 97
97 -
 98
98 -
 99
99 -
 100
100 -
 101
101 -
 102
102 -
 103
103 -
 104
104 -
 105
105 -
 106
106 -
 107
107 -
 108
108 -
 109
109 -
 110
110 -
111
-
112
-
113
-
114
-
115
-
116
-
117
-
118
-
119
-
120
-
121
-
122
-
123
-
124
-
125
-
126
-
127
-
128
-
129
-
130
-
131
-
132
-
133
-
134
-
135
-
136
-
137
-
138
-
139
-
140
-
141
-
142
-
143
-
144
-
145
-
146
 |
 |

98
earnings when the hedged transaction affects earnings.
Changes in the fair value of the ineffective portion are recognized
in current period earnings.
Derivatives not designated as hedges
Changes in the fair value of derivatives that are not designated
as hedges under FAS No. 133 are recognized in current period
earnings.
Sony formally documents all hedging relationships between
the derivatives designated as hedges and hedged items, as well
as its risk management objectives and strategies for undertaking
various hedging activities. Sony links all hedges that are desig-
nated as fair value or cash flow hedges to specific assets or
liabilities on the balance sheet or to the specific forecasted
transaction. Sony also assesses, both at the inception of the
hedge and on an on-going basis, whether the derivatives that
are designated as hedges are highly effective in offsetting
changes in fair value or cash flows of hedged items. When it is
determined that a derivative is not highly effective as a hedge,
Sony discontinues hedge accounting.
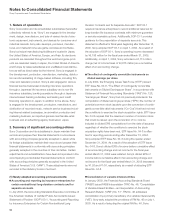
■ Stock-based compensation
Sony applies APB No. 25, “Accounting for Stock Issued to
Employees”, and its related interpretations in accounting for its
stock-based compensation plans and follows the disclosure-
only provisions of FAS No. 148, “Accounting for Stock-Based
Compensation—Transition and Disclosure—an Amendment of
FASB Statement No. 123”. In accordance with APB No. 25,
stock-based compensation cost is recognized in income based
on the excess, if any, of the quoted market price of the common
stock of Sony Corporation at the grant date of the award or
other measurement date over the stated exercise price of the
award. As the exercise prices for Sony’s stock-based compen-
sation plans are generally determined based on the prevailing
market price shortly before the date of grant, the compensation
expense for these plans is not significant. For awards that
generate compensation expense as defined under APB No. 25,
Sony calculates the amount of compensation expense and
recognizes the expense over the vesting period of the award.
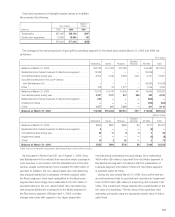
The following table reflects the net effect on net income and
net income per share allocated to the common stock if Sony
had applied the fair value recognition provisions of FAS No. 123,
“Accounting for Stock-Based Compensation”, to its stock-
based compensation. See Note 17 for detailed assumptions.
Dollars in
Yen in millions millions
Years ended March 31 2004 2005 2006 2006
Income before cumulative effect of an accounting change allocated to common stock:
As reported . . . . . . . . . . . . . . . . . . . . . . . . . . . . . . . . . . . . . . . . . . . . . . . . . . . . . . . . . .
¥90,756 ¥168,498 ¥122,308 $1,046
Deduct: Total stock-based compensation expense determined
Deduct: under the fair value based method, net of related tax effects . . . . . . . . . . . . . . .
(6,334) (4,690) (4,182) (36)
Pro forma . . . . . . . . . . . . . . . . . . . . . . . . . . . . . . . . . . . . . . . . . . . . . . . . . . . . . . . . . . . . .
¥84,422 ¥163,808 ¥118,126 $1,010
Net income allocated to common stock:
As reported . . . . . . . . . . . . . . . . . . . . . . . . . . . . . . . . . . . . . . . . . . . . . . . . . . . . . . . . . .
¥88,639 ¥163,785 ¥122,308 $1,046
Deduct: Total stock-based compensation expense determined
Deduct: under the fair value based method, net of related tax effects . . . . . . . . . . . . . . .
(6,334) (4,690) (4,182) (36)
Pro forma . . . . . . . . . . . . . . . . . . . . . . . . . . . . . . . . . . . . . . . . . . . . . . . . . . . . . . . . . . . . .
¥82,305 ¥159,095 ¥118,126 $1,010
YenDollars
Years ended March 31 2004 2005 2006 2006
Income before cumulative effect of an accounting change allocated to common stock:
Basic EPS:
As reported . . . . . . . . . . . . . . . . . . . . . . . . . . . . . . . . . . . . . . . . . . . . . . . . . . . . . . . .
¥98.26.¥180.96.¥122.58.$1.05.
Pro forma . . . . . . . . . . . . . . . . . . . . . . . . . . . . . . . . . . . . . . . . . . . . . . . . . . . . . . . . . .
91.40.175.92.118.39.1.01.
Diluted EPS:
As reported . . . . . . . . . . . . . . . . . . . . . . . . . . . . . . . . . . . . . . . . . . . . . . . . . . . . . . . .
¥89.03.¥162.59.¥116.88.$1.00.
Pro forma . . . . . . . . . . . . . . . . . . . . . . . . . . . . . . . . . . . . . . . . . . . . . . . . . . . . . . . . . .
82.96.158.10.112.91.0.97.
Net income allocated to common stock:
Basic EPS:
As reported . . . . . . . . . . . . . . . . . . . . . . . . . . . . . . . . . . . . . . . . . . . . . . . . . . . . . . . .
¥95.97.¥175.90.¥122.58.$1.05.
Pro forma . . . . . . . . . . . . . . . . . . . . . . . . . . . . . . . . . . . . . . . . . . . . . . . . . . . . . . . . . .
89.11.170.86.118.39.1.01.
Diluted EPS:
As reported . . . . . . . . . . . . . . . . . . . . . . . . . . . . . . . . . . . . . . . . . . . . . . . . . . . . . . . .
¥87.00.¥158.07.¥116.88.$1.00.
Pro forma . . . . . . . . . . . . . . . . . . . . . . . . . . . . . . . . . . . . . . . . . . . . . . . . . . . . . . . . . .
80.94.153.58.112.91.0.97.