Sony 2006 Annual Report Download - page 91
Download and view the complete annual report
Please find page 91 of the 2006 Sony annual report below. You can navigate through the pages in the report by either clicking on the pages listed below, or by using the keyword search tool below to find specific information within the annual report.-
 1
1 -
2
-
3
-
4
-
5
-
6
-
7
-
8
-
9
-
10
-
11
-
12
-
13
-
14
-
15
-
16
-
17
-
18
-
19
-
20
-
21
-
22
-
23
-
24
-
25
-
26
-
27
-
28
-
29
-
30
-
31
-
32
-
33
-
34
-
35
-
36
-
37
-
38
-
39
-
40
-
41
-
42
-
43
-
44
-
45
-
46
-
47
-
48
-
49
-
50
-
51
-
52
-
53
-
54
-
55
-
56
-
57
-
58
-
59
-
60
-
61
-
62
-
63
-
64
-
65
-
66
-
67
-
68
-
69
-
70
-
71
-
72
-
73
-
74
-
75
-
76
-
77
-
78
-
79
-
80
-
 81
81 -
 82
82 -
 83
83 -
 84
84 -
 85
85 -
 86
86 -
 87
87 -
 88
88 -
 89
89 -
 90
90 -
 91
91 -
 92
92 -
 93
93 -
 94
94 -
 95
95 -
 96
96 -
 97
97 -
 98
98 -
 99
99 -
 100
100 -
 101
101 -
102
-
103
-
104
-
105
-
106
-
107
-
108
-
109
-
110
-
111
-
112
-
113
-
114
-
115
-
116
-
117
-
118
-
119
-
120
-
121
-
122
-
123
-
124
-
125
-
126
-
127
-
128
-
129
-
130
-
131
-
132
-
133
-
134
-
135
-
136
-
137
-
138
-
139
-
140
-
141
-
142
-
143
-
144
-
145
-
146
 |
 |

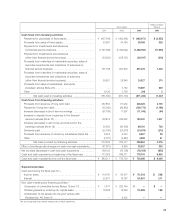
89
Dollars in millions
Yen in millions (Note 3)
2004 2005 2006 2006
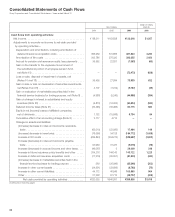
Cash flows from investing activities:
Payments for purchases of fixed assets . . . . . . . . . . . . . . . . . . .
¥ (427,344) ¥ (453,445) ¥ (462,473) $ (3,953)
Proceeds from sales of fixed assets . . . . . . . . . . . . . . . . . . . . . .
33,987 34,184 38,168 326
Payments for investments and advances
by financial service business . . . . . . . . . . . . . . . . . . . . . . . . . . .
(1,167,945) (1,309,092) (1,368,158) (11,694)
Payments for investments and advances
(other than financial service business) . . . . . . . . . . . . . . . . . . . .
(33,329) (158,151) (36,947) (316)
Proceeds from maturities of marketable securities, sales of
securities investments and collections of advances by
financial service business . . . . . . . . . . . . . . . . . . . . . . . . . . . . .
791,188 923,593 857,376 7,328
Proceeds from maturities of marketable securities, sales of
securities investments and collections of advances
(other than financial service business) . . . . . . . . . . . . . . . . . . . .
35,521 25,849 24,527 210
Proceeds from sales of subsidiaries’ and equity
investees’ stocks (Note 20) . . . . . . . . . . . . . . . . . . . . . . . . . . . .
—3,162 75,897 649
Other . . . . . . . . . . . . . . . . . . . . . . . . . . . . . . . . . . . . . . . . . . . . .
6,130 2,728 346 3
Net cash used in investing activities . . . . . . . . . . . . . . .
(761,792) (931,172) (871,264) (7,447)
Cash flows from financing activities:
Proceeds from issuance of long-term debt . . . . . . . . . . . . . . . . .
267,864 57,232 246,326 2,105
Payments of long-term debt . . . . . . . . . . . . . . . . . . . . . . . . . . . .
(32,042) (94,862) (138,773) (1,186)
Increase (decrease) in short-term borrowings . . . . . . . . . . . . . . .
(57,708) 11,397 (11,045) (94)
Increase in deposits from customers in the financial
service business (Note 13) . . . . . . . . . . . . . . . . . . . . . . . . . . . .
129,874 294,352 190,320 1,627
Increase (decrease) in call money and bills sold in the
banking business (Note 12) . . . . . . . . . . . . . . . . . . . . . . . . . . .
30,300 (40,400) 86,100 736
Dividends paid . . . . . . . . . . . . . . . . . . . . . . . . . . . . . . . . . . . . . .
(23,106) (22,978) (24,810) (212)
Proceeds from issuance of stocks by subsidiaries (Note 20) . . . .
5,252 4,023 6,937 59
Other . . . . . . . . . . . . . . . . . . . . . . . . . . . . . . . . . . . . . . . . . . . . .
(7,151) (3,587) 4,809 41
Net cash provided by financing activities . . . . . . . . . . . .
313,283 205,177 359,864 3,076
Effect of exchange rate changes on cash and cash equivalents . . .
(47,973) 8,890 35,537 303
Net increase (decrease) in cash and cash equivalents . . . . . . . . . .
136,153 (70,108) (76,005) (650)
Cash and cash equivalents at beginning of the fiscal year . . . . . . .
713,058 849,211 779,103 6,659
Cash and cash equivalents at end of the fiscal year . . . . . . . . . . . .
¥ 849,211 ¥ 779,103 ¥ 703,098 $ 6,009
Supplemental data:
Cash paid during the fiscal year for—
Income taxes . . . . . . . . . . . . . . . . . . . . . . . . . . . . . . . . . . . . . . .
¥ 114,781 ¥ 65,477
¥ 70,019 $ 598
Interest . . . . . . . . . . . . . . . . . . . . . . . . . . . . . . . . . . . . . . . . . . . .
22,571 18,187
24,651 211
Non-cash investing and financing activities—
Conversion of convertible bonds (Notes 16 and 17) . . . . . . . . . .
¥ 7,977 ¥ 282,744
¥ — $ —
Obtaining assets by entering into capital lease . . . . . . . . . . . . . .
18,298 19,049
19,682 168
Contribution of net assets into the joint venture with
Bertelsmann AG (Note 6) . . . . . . . . . . . . . . . . . . . . . . . . . . . . .
—9,402 ——
The accompanying notes are an integral part of these statements.