Sony 2006 Annual Report Download - page 59
Download and view the complete annual report
Please find page 59 of the 2006 Sony annual report below. You can navigate through the pages in the report by either clicking on the pages listed below, or by using the keyword search tool below to find specific information within the annual report.-
 1
1 -
2
-
3
-
4
-
5
-
6
-
7
-
8
-
9
-
10
-
11
-
12
-
13
-
14
-
15
-
16
-
17
-
18
-
19
-
20
-
21
-
22
-
23
-
24
-
25
-
26
-
27
-
28
-
29
-
30
-
31
-
32
-
33
-
34
-
35
-
36
-
37
-
38
-
39
-
40
-
41
-
42
-
43
-
44
-
45
-
46
-
47
-
48
-
 49
49 -
 50
50 -
 51
51 -
 52
52 -
 53
53 -
 54
54 -
 55
55 -
 56
56 -
 57
57 -
 58
58 -
 59
59 -
 60
60 -
 61
61 -
 62
62 -
 63
63 -
 64
64 -
 65
65 -
 66
66 -
 67
67 -
 68
68 -
 69
69 -
70
-
71
-
72
-
73
-
74
-
75
-
76
-
77
-
78
-
79
-
80
-
81
-
82
-
83
-
84
-
85
-
86
-
87
-
88
-
89
-
90
-
91
-
92
-
93
-
94
-
95
-
96
-
97
-
98
-
99
-
100
-
101
-
102
-
103
-
104
-
105
-
106
-
107
-
108
-
109
-
110
-
111
-
112
-
113
-
114
-
115
-
116
-
117
-
118
-
119
-
120
-
121
-
122
-
123
-
124
-
125
-
126
-
127
-
128
-
129
-
130
-
131
-
132
-
133
-
134
-
135
-
136
-
137
-
138
-
139
-
140
-
141
-
142
-
143
-
144
-
145
-
146
 |
 |

57
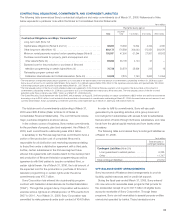
●Condensed Statements of Income Separating Out the
Financial Services Segment (Unaudited)
The following schedule shows unaudited condensed statements
of income for the Financial Services segment and all other
segments excluding Financial Services as well as condensed
consolidated statements of income. This presentation is not
required under U.S. GAAP, which is used in Sony’s consolidated
financial statements. However, because the Financial Services
N
segment is different in nature from Sony’s other segments,
Sony believes that a comparative presentation may be useful
in understanding and analyzing Sony’s consolidated financial
statements.
Transactions between the Financial Services segment and all
other segments excluding Financial Services are eliminated in
the consolidated figures shown below.
CONDENSED STATEMENTS OF INCOME SEPARATING OUT THE FINANCIAL SERVICES SEGMENT
Yen in millions
Sony without
Financial Services Financial Services Consolidated
Fiscal Years Ended March 31 2005 2006 2005 2006 2005 2006
Financial Services revenue . . . . . . . . . . . . . . . . . . . . . . . . . . . . . .
560,557 743,215 ——537,715 720,566
Net sales and operating revenue . . . . . . . . . . . . . . . . . . . . . . . . .
——6,632,728 6,763,907 6,621,901 6,754,870
. . . . . . . . . . . . . . . . . . . . . . . . . . . . . . . . . . . . . . . . . . . . . . . . . .
560,557 743,215 6,632,728 6,763,907 7,159,616 7,475,436
Costs and expenses . . . . . . . . . . . . . . . . . . . . . . . . . . . . . . . . . .
505,067 554,892 6,575,354 6,762,375 7,045,697 7,284,181
Operating income . . . . . . . . . . . . . . . . . . . . . . . . . . . . . . . . . . . .
55,490 188,323 57,374 1,532 113,919 191,255
Other income (expenses), net . . . . . . . . . . . . . . . . . . . . . . . . . . .
10,204 24,522 40,639 71,952 43,288 95,074
Income before income taxes . . . . . . . . . . . . . . . . . . . . . . . . . . . .
65,694 212,845 98,013 73,484 157,207 286,329
Income taxes and other . . . . . . . . . . . . . . . . . . . . . . . . . . . . . . . .
25,698 80,586 (37,043) 82,127 (11,344) 162,713
Income before cumulative effect of an accounting change . . . . . .
39,996 132,259 135,056 (8,643) 168,551 123,616
Cumulative effect of an accounting change . . . . . . . . . . . . . . . . .
(4,713) ———(4,713) —
Net income . . . . . . . . . . . . . . . . . . . . . . . . . . . . . . . . . . . . . . . . .
35,283 132,259 135,056 (8,643) 163,838 123,616
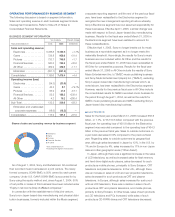
■ALL OTHER
During the fiscal year ended March 31, 2006, sales within All
Other were comprised mainly of sales from SMEJ, a Japanese
domestic recorded music business; SMEI’s music publishing
business; SCN, an Internet-related service business subsidiary
operating mainly in Japan; a retailer of imported general
merchandise in Japan; an in-house facilities management
business in Japan; and an advertising agency business in
Japan. Results for the first four months of the previous fiscal
year in All Other incorporated the results for SMEI’s recorded
music business, which, as noted above, was combined with
Bertelsmann AG’s recorded music business to form the SONY
BMG joint venture which is accounted for by the equity method.
Sales for the fiscal year ended March 31, 2006 decreased by
¥51.0 billion, or 11.1%, to ¥408.9 billion, compared with the
previous fiscal year. Of total segment sales, 80% were sales to
outside customers. In terms of profit performance, operating in-
come for All Other increased for the fiscal year from ¥4.2 billion
to ¥16.2 billion.
During the fiscal year, the sales decrease within All Other
reflects the fact that, as noted above, the results for the first four
months of the previous fiscal year in All Other incorporated the
results for SMEI’s recorded music business.
Sales at SMEJ were relatively unchanged compared with the
previous fiscal year. Best selling albums during the fiscal year
included Ken Hirai 10th Anniversary Complete Single Collection
’95–’05 “Uta Baka” by Ken Hirai, ATURAL by ORANGE
RANGE and BEST by Mika Nakashima.
Excluding sales recorded within Sony’s music business, there
was an increase in sales within All Other. This increase was mainly
due to strong sales at a business engaged in the production and
marketing of animation products, favorable sales both at SCN
and its subsidiaries, as well as an increase in sales recorded at
an imported general merchandise retail business.
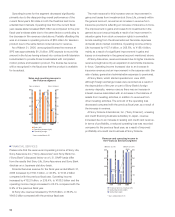
Regarding profit performance within All Other, operating
income of ¥16.2 billion was recorded, an ¥12.0 billion increase
compared to the ¥4.2 billion of operating income recorded in the
previous fiscal year. This increase was mainly the result of the
fact that the results for SMEI’s recorded music business, which
recorded an operating loss in the previous fiscal year, are now
recorded as part of the results of the SONY BMG joint venture,
and the continued strong performance at SMEJ, where
operating income increased approximately 40% compared to
the previous fiscal year mainly due to an improvement in the
cost of sales ratio and the recording of a net gain resulting from
the transfer to the Japanese government of the substitutional
portion of Sony’s Employee Pension Fund.