Sony 2006 Annual Report Download - page 61
Download and view the complete annual report
Please find page 61 of the 2006 Sony annual report below. You can navigate through the pages in the report by either clicking on the pages listed below, or by using the keyword search tool below to find specific information within the annual report.-
 1
1 -
2
-
3
-
4
-
5
-
6
-
7
-
8
-
9
-
10
-
11
-
12
-
13
-
14
-
15
-
16
-
17
-
18
-
19
-
20
-
21
-
22
-
23
-
24
-
25
-
26
-
27
-
28
-
29
-
30
-
31
-
32
-
33
-
34
-
35
-
36
-
37
-
38
-
39
-
40
-
41
-
42
-
43
-
44
-
45
-
46
-
47
-
48
-
49
-
50
-
 51
51 -
 52
52 -
 53
53 -
 54
54 -
 55
55 -
 56
56 -
 57
57 -
 58
58 -
 59
59 -
 60
60 -
 61
61 -
 62
62 -
 63
63 -
 64
64 -
 65
65 -
 66
66 -
 67
67 -
 68
68 -
 69
69 -
 70
70 -
 71
71 -
72
-
73
-
74
-
75
-
76
-
77
-
78
-
79
-
80
-
81
-
82
-
83
-
84
-
85
-
86
-
87
-
88
-
89
-
90
-
91
-
92
-
93
-
94
-
95
-
96
-
97
-
98
-
99
-
100
-
101
-
102
-
103
-
104
-
105
-
106
-
107
-
108
-
109
-
110
-
111
-
112
-
113
-
114
-
115
-
116
-
117
-
118
-
119
-
120
-
121
-
122
-
123
-
124
-
125
-
126
-
127
-
128
-
129
-
130
-
131
-
132
-
133
-
134
-
135
-
136
-
137
-
138
-
139
-
140
-
141
-
142
-
143
-
144
-
145
-
146
 |
 |
59
Financial Services segment utilized for portfolio investments and
Asset Liability Management (“ALM”).
To minimize the adverse effects of foreign exchange fluctuations
on its financial results, particularly in the Electronics segment,
Sony seeks, when appropriate, to localize material and parts
procurement, design, and manufacturing operations in areas
outside of Japan.
Changes in the fair value of derivatives designated as cash
flow hedges, including foreign exchange forward contracts and
foreign currency option contracts, are initially recorded in
accumulated other comprehensive income and reclassified into
earnings when the hedged transaction affects earnings. Foreign
exchange forward contracts, foreign currency option contracts
and other derivatives that do not qualify as hedges are marked-
to-market with changes in value recognized in Other Income
and Expenses. The notional amounts of foreign exchange
forward contracts, currency option contracts purchased and
currency option contracts written as of March 31, 2006 were
¥1,489.2 billion, ¥457.4 billion and ¥163.7 billion, respectively.
ASSETS, LIABILITIES AND STOCKHOLDERS’
EQUITY
ASSETS
Total assets on March 31, 2006 increased by ¥1,108.7 billion, or
11.7%, to ¥10,607.8 billion, compared with the previous fiscal
year-end. Total assets on March 31, 2006 in all segments
excluding the Financial Services segment increased by ¥364.4
billion, or 6.0%, to ¥6,392.3 billion and total assets on March 31,
2006 in the Financial Services segment increased by ¥680.1
billion, or 17.5%, to ¥4,565.6 billion, compared with the previous
fiscal year-end. Total assets on March 31, 2006 in all segments
excluding the Financial Services segment would have increased
by approximately 2% compared with the previous fiscal
year-end if the value of the yen had remained the same on
March 31, 2006 as it was on March 31, 2005.
■CURRENT ASSETS
Current assets on March 31, 2006 increased by ¥213.4 billion,
or 6.0%, to ¥3,769.5 billion compared with the previous fiscal
year-end. Current assets on March 31, 2006 in all segments
excluding the Financial Services segment increased by ¥363.7
billion, or 14.0%, to ¥2,956.5 billion.
Cash and cash equivalents on March 31, 2006 in all segments
excluding the Financial Services segment increased ¥65.7
billion, or 12.6%, to ¥585.5 billion compared with the previous
fiscal year-end. This is primarily a result of an increase in cash
equivalents in association with the issuance of straight bonds
carried out by Sony Corporation and the initial public offering
of SCN.
Notes and accounts receivable, trade (net of allowance for
doubtful accounts and sales returns) on March 31, 2006
excluding the Financial Services segment increased ¥21.0
billion, or 2.2%, compared with the previous fiscal year-end to
¥973.7 billion.
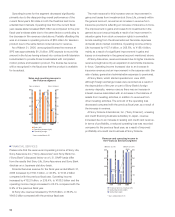
Inventories on March 31, 2006 increased by ¥173.4 billion, or
27.5%, to ¥804.7 billion compared with the previous fiscal year-
end. This increase was primarily a result of both increased
semiconductor inventory, primarily for use in PS3,
and LCD television inventory in the Electronics segment and
increased inventory in the Game segment resulting from the
world-wide full-scale introduction of the PSP platform. The
inventory to cost of sales turnover ratio (based on the average
of inventories at the end of each fiscal year and previous fiscal
year) was 1.67 months compared to 1.56 months at the end of
the previous fiscal year. Sony considers this level of inventory to
be appropriate in the aggregate.
Current assets on March 31, 2006 in the Financial Services
segment decreased by ¥138.7 billion, or 14.0%, to ¥851.5
billion, compared with the previous fiscal year-end. This
decrease was primarily attributable to the fact that cash and
cash equivalents were utilized for investments and advances.
■INVESTMENTS AND ADVANCES
Investments and advances on March 31, 2006 increased by
¥774.2 billion, or 28.2%, to ¥3,519.9 billion, compared with the
previous fiscal year-end.
Investments and advances on March 31, 2006 in all segments
excluding the Financial Services segment increased by ¥31.6
billion, or 7.1%, to ¥477.1 billion. This was primarily a result of
an increase in investments and advances towards affiliated
companies such as MGM Holdings.
Investments and advances on March 31, 2006 in the Financial
Services segment increased by ¥749.8 billion, or 31.5%, to
¥3,128.7 billion, compared with the previous fiscal year-end.
This increase was primarily due to investments mainly in
Japanese fixed income securities resulting from an increase in
insurance premiums at Sony Life, and an increase in mortgage
loans at Sony Bank.
Also see “Investments” below.