Sony 2006 Annual Report Download - page 58
Download and view the complete annual report
Please find page 58 of the 2006 Sony annual report below. You can navigate through the pages in the report by either clicking on the pages listed below, or by using the keyword search tool below to find specific information within the annual report.-
 1
1 -
2
-
3
-
4
-
5
-
6
-
7
-
8
-
9
-
10
-
11
-
12
-
13
-
14
-
15
-
16
-
17
-
18
-
19
-
20
-
21
-
22
-
23
-
24
-
25
-
26
-
27
-
28
-
29
-
30
-
31
-
32
-
33
-
34
-
35
-
36
-
37
-
38
-
39
-
40
-
41
-
42
-
43
-
44
-
45
-
46
-
47
-
 48
48 -
 49
49 -
 50
50 -
 51
51 -
 52
52 -
 53
53 -
 54
54 -
 55
55 -
 56
56 -
 57
57 -
 58
58 -
 59
59 -
 60
60 -
 61
61 -
 62
62 -
 63
63 -
 64
64 -
 65
65 -
 66
66 -
 67
67 -
 68
68 -
69
-
70
-
71
-
72
-
73
-
74
-
75
-
76
-
77
-
78
-
79
-
80
-
81
-
82
-
83
-
84
-
85
-
86
-
87
-
88
-
89
-
90
-
91
-
92
-
93
-
94
-
95
-
96
-
97
-
98
-
99
-
100
-
101
-
102
-
103
-
104
-
105
-
106
-
107
-
108
-
109
-
110
-
111
-
112
-
113
-
114
-
115
-
116
-
117
-
118
-
119
-
120
-
121
-
122
-
123
-
124
-
125
-
126
-
127
-
128
-
129
-
130
-
131
-
132
-
133
-
134
-
135
-
136
-
137
-
138
-
139
-
140
-
141
-
142
-
143
-
144
-
145
-
146
 |
 |
56
The main reasons for this increase were an improvement in
gains and losses from investments at Sony Life, primarily within
the general account, as well as an increase in revenue from
insurance premiums reflecting an increase of insurance-in-force.
The improvement in gains and losses from investments in the
general account was principally a result of an improvement in
valuation gains from stock conversion rights in convertible
bonds resulting from the aforementioned favorable Japanese
domestic stock market conditions. Operating income at Sony
Life increased by ¥127.4 billion, or 208.8%, to ¥188.4 billion,
mainly as a result of a significant improvement in gains and
losses on investments in the general account mentioned above.
At Sony Assurance, revenue increased due to higher insurance
revenue brought about by an expansion in automobile insurance-
in-force. Operating income increased due to an increase in
insurance revenue and an improvement in the expense ratio (the
ratio of sales, general and administrative expenses to premiums).
At Sony Bank, which started operations in June 2001,
although foreign exchange losses were recorded as a result of
the depreciation of the yen on part of Sony Bank’s foreign
currency deposits, revenue rose as there was an increase in
interest revenue associated with an increase in the balance of
assets from investing activities, in addition to revenues from
other investing activities. The amount of the operating loss
decreased compared with the previous fiscal year, as a result of
the increase in revenue.
At Sony Finance International, Inc. (“Sony Finance”), a leasing
and credit financing business subsidiary in Japan, revenue
increased due to an increase in leasing and credit card revenue.
In terms of profitability, a reduced operating loss was recorded
compared to the previous fiscal year, as a result of improved
profitability at a credit card business at Sony Finance.
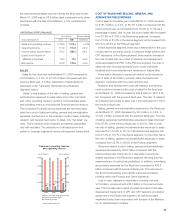
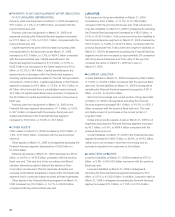
Operating income for the segment decreased significantly,
primarily due to the disappointing overall performance of the
current fiscal year’s film slate in both the theatrical and home
entertainment markets. Operating loss from the current fiscal
year release slate increased $623 million as compared to the prior
fiscal year’s release slate due to the same factors contributing to
the decrease in film revenue noted above. Partially offsetting this
was an increase in operating income of $83 million for television
product due to the same factors noted above for revenue.
As of March 31, 2006, unrecognized license fee revenue at
SPE was approximately $1.2 billion. SPE expects to record this
amount in the future having entered into contracts with television
broadcasters to provide those broadcasters with completed
motion picture and television product. The license fee revenue
will be recognized in the fiscal year that the product is available
for broadcast.
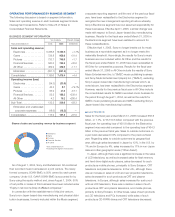
■FINANCIAL SERVICES
Please note that the revenue and operating income at Sony Life,
Sony Assurance Inc. (“Sony Assurance”) and Sony Bank Inc.
(“Sony Bank”) discussed below on a U.S. GAAP basis differ
from the results that Sony Life, Sony Assurance and Sony Bank
disclose on a Japanese statutory basis.
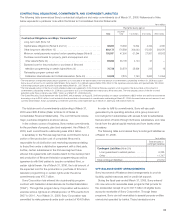
Financial Services revenue for the fiscal year ended March 31,
2006 increased by ¥182.7 billion, or 32.6%, to ¥743.2 billion
compared with the previous fiscal year. Operating income
increased by ¥132.8 billion, or 239.4%, to ¥188.3 billion and the
operating income margin increased to 25.3% compared with the
9.9% of the previous fiscal year.
At Sony Life, revenue increased by ¥170.8 billion, or 36.0%, to
¥645.0 billion compared with the previous fiscal year.
Sales and operating income in
the Pictures segment
■ Sales (left)
■ Operating income (right)
● Operating margin
*Years ended March 31
800
600
400
200
0
80
60
40
20
0
2004 2005 2006
8.7%
4.7%
3.7%
(Yen in billions) (Yen in billions)
(Billions of yen) (Billions of yen)
Revenue and operating income in
the Financial Services segment
■ Financial Services revenue (left)
■ Operating income (right)
● Operating margin
*Years ended March 31
800
600
400
200
0
200
150
100
50
0
2004 2005 2006
9.3%
9.9%
25.3%