Sony 2006 Annual Report Download - page 53
Download and view the complete annual report
Please find page 53 of the 2006 Sony annual report below. You can navigate through the pages in the report by either clicking on the pages listed below, or by using the keyword search tool below to find specific information within the annual report.-
 1
1 -
2
-
3
-
4
-
5
-
6
-
7
-
8
-
9
-
10
-
11
-
12
-
13
-
14
-
15
-
16
-
17
-
18
-
19
-
20
-
21
-
22
-
23
-
24
-
25
-
26
-
27
-
28
-
29
-
30
-
31
-
32
-
33
-
34
-
35
-
36
-
37
-
38
-
39
-
40
-
41
-
42
-
 43
43 -
 44
44 -
 45
45 -
 46
46 -
 47
47 -
 48
48 -
 49
49 -
 50
50 -
 51
51 -
 52
52 -
 53
53 -
 54
54 -
 55
55 -
 56
56 -
 57
57 -
 58
58 -
 59
59 -
 60
60 -
 61
61 -
 62
62 -
 63
63 -
64
-
65
-
66
-
67
-
68
-
69
-
70
-
71
-
72
-
73
-
74
-
75
-
76
-
77
-
78
-
79
-
80
-
81
-
82
-
83
-
84
-
85
-
86
-
87
-
88
-
89
-
90
-
91
-
92
-
93
-
94
-
95
-
96
-
97
-
98
-
99
-
100
-
101
-
102
-
103
-
104
-
105
-
106
-
107
-
108
-
109
-
110
-
111
-
112
-
113
-
114
-
115
-
116
-
117
-
118
-
119
-
120
-
121
-
122
-
123
-
124
-
125
-
126
-
127
-
128
-
129
-
130
-
131
-
132
-
133
-
134
-
135
-
136
-
137
-
138
-
139
-
140
-
141
-
142
-
143
-
144
-
145
-
146
 |
 |

51
On June 30, 2006, Sony Corporation and SCEI each received
notification from the Tokyo Regional Taxation Bureau (“TRTB”) of
a reassessment of the profits they reported from transactions
between SCEI and its subsidiary Sony Computer Entertainment
America Inc. (“SCEA”), for the fiscal years ended March 31,
2000 through 2005. On the same date, Sony Corporation also
received notification of a reassessment of the profits reported
from transactions related to CD and DVD disc manufacturing
operations with a number of its overseas subsidiaries for the
fiscal years ended March 31, 2004 and 2005.
Sony Corporation and SCEI believe that their allocation of
income for the periods in question was appropriate and that they
have paid the proper amount of taxes in each of the jurisdictions.
Therefore Sony Corporation and SCEI disagree with the position
of the TRTB and have lodged an objection. In addition,
Sony Corporation and SCEI plan to formally request bilateral
consultations (where available) to obtain relief from double
taxation under the applicable tax treaties of various countries.
Transfer pricing was reassessed in accordance with the
notification from the TRTB, resulting in additional Japanese
income of ¥74.4 billion, which led to Sony Corporation and
SCEI incurring an estimated additional cash tax (including
corporate tax and others) of approximately ¥27.9 billion. Sony
Corporation and SCEI believe that double taxation will be
avoided through the above procedures, and therefore Sony
does not expect any material impact on its consolidated profit
and loss as a result of this reassessment.
RESULTS OF AFFILIATED COMPANIES ACCOUNTED FOR
UNDER THE EQUITY METHOD
Equity in net income of affiliated companies during the fiscal year
ended March 31, 2006 was ¥13.2 billion, a decrease of ¥15.9
billion, or 54.6% compared to the previous fiscal year. Equity in
net income of affiliated companies for the previous fiscal year
included the recording of ¥12.6 billion as equity in net income
for InterTrust Technologies Corporation (“InterTrust”), which
reflected InterTrust’s proceeds from a license agreement arising
from the settlement of a patent-related suit. In the current fiscal
year, Sony Ericsson Mobile Communications AB (“Sony
Ericsson”), as a result of increased sales of products including
camera phone and “Walkman®” phone models, contributed
¥29.0 billion to equity in net income, an increase of ¥11.6 billion
compared to the previous fiscal year. Sony recorded equity
income of ¥5.8 billion for SONY BMG MUSIC ENTERTAINMENT
(“SONY BMG”), during the current fiscal year, compared to an
equity loss of ¥3.4 billion in the previous fiscal year as a result
of a reduction in restructuring charges and the realization of
incremental cost savings. However, Sony recorded an equity in
net loss of ¥7.2 billion for S-LCD Corporation (“S-LCD”), a joint-
venture with Samsung Electronics Co., Ltd. for the manufacture
of amorphous TFT LCD panels and equity in net loss of
¥16.9 billion for MGM Holdings, Inc. (“MGM Holdings”). The
equity in net loss for MGM Holdings includes non-cash interest
of ¥6.0 billion on cumulative preferred stock.
MINORITY INTEREST IN INCOME (LOSS) OF
CONSOLIDATED SUBSIDIARIES
In the fiscal year ended March 31, 2006, minority interest in
loss of consolidated subsidiaries of ¥0.6 billion was recorded
compared to minority interest in income of ¥1.7 billion previous
year. This loss was primarily due to the recording of loss at
ST Mobile Display Corporation, a joint venture with Toyota
Industries Corporation for the manufacture of low-temperature
polysilicon thin film transistor liquid crystal display panels for
mobile products.
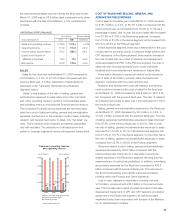
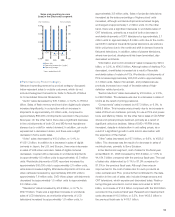
NET INCOME
Net income for the fiscal year ended March 31, 2006 decreased
by ¥40.2 billion, or 24.5%, to ¥123.6 billion compared with the
previous fiscal year. This decrease was primarily the result of the
above-mentioned increase in income taxes and decrease in
equity in net income of affiliated companies. As a percentage
of sales, net income decreased from 2.3% to 1.7%. Return on
stockholders’ equity decreased from 6.2% to 4.1%. (This ratio
is calculated by dividing net income by the simple average of
stockholders’ equity at the end of the previous fiscal year and at
the end of the fiscal year ended March 31, 2006.)
Basic net income per share was ¥122.58 compared with
¥175.90 in the previous fiscal year, and diluted net income per
share was ¥116.88 compared with ¥158.07 in the previous
fiscal year. Refer to Notes 2 and 22 of Notes to Consolidated
Financial Statements.
Net income and ROE
■ Net income
● ROE
*Years ended March 31
(Yen in billions) (%) (Yen)
Net income per share of
common stock
■ Basic
■ Diluted
*Years ended March 31
200
150
100
50
02004 2005 2006
8
6
4
2
0
200
150
100
50
02004 2005 2006
3.8%
6.2%
4.1%