Sony 2006 Annual Report Download - page 104
Download and view the complete annual report
Please find page 104 of the 2006 Sony annual report below. You can navigate through the pages in the report by either clicking on the pages listed below, or by using the keyword search tool below to find specific information within the annual report.-
 1
1 -
2
-
3
-
4
-
5
-
6
-
7
-
8
-
9
-
10
-
11
-
12
-
13
-
14
-
15
-
16
-
17
-
18
-
19
-
20
-
21
-
22
-
23
-
24
-
25
-
26
-
27
-
28
-
29
-
30
-
31
-
32
-
33
-
34
-
35
-
36
-
37
-
38
-
39
-
40
-
41
-
42
-
43
-
44
-
45
-
46
-
47
-
48
-
49
-
50
-
51
-
52
-
53
-
54
-
55
-
56
-
57
-
58
-
59
-
60
-
61
-
62
-
63
-
64
-
65
-
66
-
67
-
68
-
69
-
70
-
71
-
72
-
73
-
74
-
75
-
76
-
77
-
78
-
79
-
80
-
81
-
82
-
83
-
84
-
85
-
86
-
87
-
88
-
89
-
90
-
91
-
92
-
93
-
 94
94 -
 95
95 -
 96
96 -
 97
97 -
 98
98 -
 99
99 -
 100
100 -
 101
101 -
 102
102 -
 103
103 -
 104
104 -
 105
105 -
 106
106 -
 107
107 -
 108
108 -
 109
109 -
 110
110 -
 111
111 -
 112
112 -
 113
113 -
 114
114 -
115
-
116
-
117
-
118
-
119
-
120
-
121
-
122
-
123
-
124
-
125
-
126
-
127
-
128
-
129
-
130
-
131
-
132
-
133
-
134
-
135
-
136
-
137
-
138
-
139
-
140
-
141
-
142
-
143
-
144
-
145
-
146
 |
 |
102
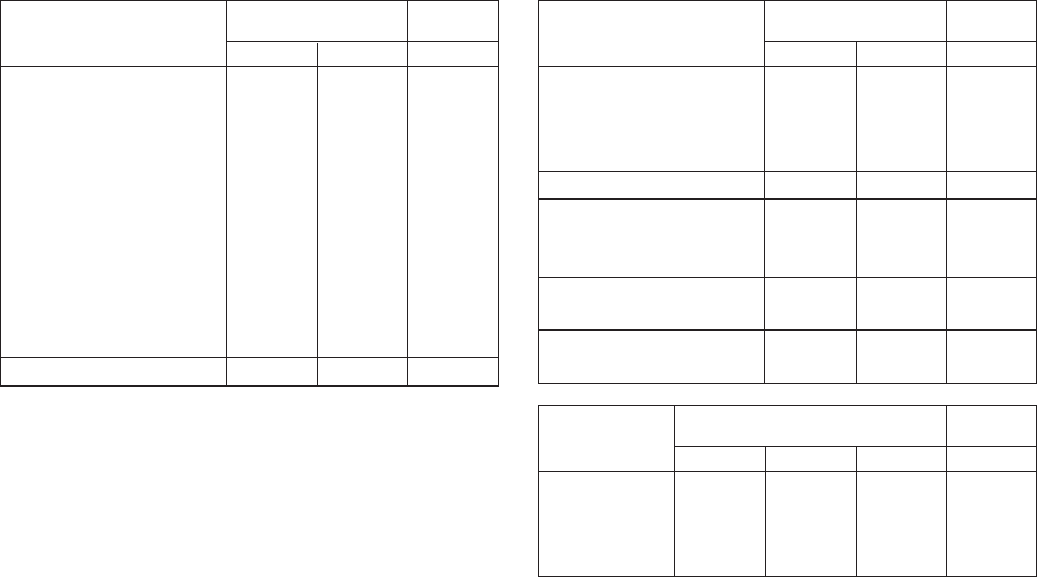
Summarized combined financial information that is based on
information provided by equity investees is shown below:
Dollars in
Yen in millions millions
March 31 2005 2006 2006
Current assets . . . . . . . . . . .
¥ 942,328 ¥ 991,440 $ 8,474
Property, plant and
equipment . . . . . . . . . . . . .
361,406 376,155 3,215
Other assets . . . . . . . . . . . .
250,245 903,873 7,725
Total assets . . . . . . . . . . .
¥1,553,979 ¥2,271,468 $19,414
Current liabilities . . . . . . . . . .
¥ 876,430 ¥1,009,895 $ 8,632
Long-term liabilities . . . . . . .
115,999 660,504 5,645
Stockholders’ equity . . . . . .
561,550 601,069 5,137
Total liabilities and
stockholders’ equity . . . .
¥1,553,979 ¥2,271,468 $19,414
Number of companies
at end of the fiscal year . . .
56 58
Dollars in
Yen in millions millions
Years ended March 31 2004 2005 2006 2006
Sales and
revenue . . . . .
¥1,009,005 ¥1,473,273 ¥2,357,172 $20,147
Gross profit . . . 231,083 477,796 668,226 5,711
Net income . . . 11,323 63,404 32,982 282
S-LCD, a joint venture with Samsung Electronics Co., LTD
focused on manufacturing amorphous TFT panel, was estab-
lished in April 2004 as a joint venture in which Sony has an
ownership interest of 50% minus 1 share. Sony invested
¥100,073 million in S-LCD during the fiscal year ended
March 31, 2005.
As of August 1, 2004, Sony combined its recorded music
business, except for the operations of its recorded music busi-
ness in Japan, with the recorded music business of Bertelsmann
AG in a joint venture. The newly formed company, known as
SONY BMG, is 50% owned by each parent company. As a
result, the results of the recorded music business, except for the
recorded music business in Japan, are no longer consolidated
but are accounted for under the equity method.
On April 8, 2005, a consortium led by Sony Corporation of
America (“SCA”) and its equity partners, Providence Equity
Partners, Texas Pacific Group, Comcast Corporation and DLJ
Merchant Banking Partners, completed the acquisition of Metro–
Goldwyn–Mayer Inc. (“MGM”). Under the terms of the acquisition
agreement, the aforementioned investor group acquired MGM for
$12.00 in cash per MGM share, for a total purchase price of
approximately $5.0 billion. In conjunction with the acquisition,
Sony Pictures Entertainment (“SPE”) entered into agreements to
co-finance and produce new motion pictures with MGM, and to
distribute MGM’s existing film and television content through
SPE’s global distribution channels.
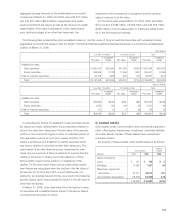
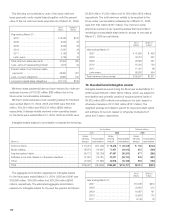
5. Film costs
Film costs comprise the following:
Dollars in
Yen in millions millions
March 31 2005 2006 2006
Theatrical:
Released (including
acquired film libraries) . . .
¥119,438 ¥153,992 $1,316
Completed not released . .
11,358 13,377 114
In production and
development . . . . . . . . .
118,271 156,019 1,333
Television licensing:
Released (including
acquired film libraries) . . .
29,894 36,918 316
In production and
development . . . . . . . . .
—66 1
. . . . . . . . . . . . . . . . . . . .
¥278,961 ¥360,372 $3,080
Sony estimates that approximately 88% of unamortized costs
of released films (excluding amounts allocated to acquired film
libraries) at March 31, 2006 will be amortized within the next
three years. Approximately ¥102,207 million ($874 million) of
released film costs are expected to be amortized during the next
twelve months. As of March 31, 2006, unamortized acquired
film libraries of approximately ¥10,820 million ($92 million)
remained to be amortized on a straight-line basis over an aver-
age of the remaining life of 4 years. Approximately ¥137,400
million ($1,174 million) of accrued participation liabilities included
in accounts payable, other and accrued expenses are expected
to be paid during the next twelve months.
6. Related party transactions
Sony accounts for its investments in affiliated companies over
which Sony has significant influence or ownership of 20% or
more but less than or equal to 50% under the equity method.
In addition, investments in general partnerships in which Sony
does not have a controlling interest and limited partnerships are
also accounted for under the equity method. Such investments
include but are not limited to Sony’s interest in Sony Ericsson
Mobile Communications, AB (50%), SONY BMG MUSIC
ENTERTAINMENT (“SONY BMG”) (50%), S-LCD Corporation
(“S-LCD”) (50% minus 1 share), ST Liquid Crystal Display
Corporation (50%), InterTrust Technologies Corporation (49.5%),
MGM Holdings, Inc. (“MGM Holdings”) (20%), bit Wallet, Inc
(34.6%), and STAR CHANNEL, INC. (17.8%).