Sony 2006 Annual Report Download - page 3
Download and view the complete annual report
Please find page 3 of the 2006 Sony annual report below. You can navigate through the pages in the report by either clicking on the pages listed below, or by using the keyword search tool below to find specific information within the annual report.-
 1
1 -
 2
2 -
 3
3 -
 4
4 -
 5
5 -
 6
6 -
 7
7 -
 8
8 -
 9
9 -
 10
10 -
 11
11 -
 12
12 -
 13
13 -
 14
14 -
15
-
16
-
17
-
18
-
19
-
20
-
21
-
22
-
23
-
24
-
25
-
26
-
27
-
28
-
29
-
30
-
31
-
32
-
33
-
34
-
35
-
36
-
37
-
38
-
39
-
40
-
41
-
42
-
43
-
44
-
45
-
46
-
47
-
48
-
49
-
50
-
51
-
52
-
53
-
54
-
55
-
56
-
57
-
58
-
59
-
60
-
61
-
62
-
63
-
64
-
65
-
66
-
67
-
68
-
69
-
70
-
71
-
72
-
73
-
74
-
75
-
76
-
77
-
78
-
79
-
80
-
81
-
82
-
83
-
84
-
85
-
86
-
87
-
88
-
89
-
90
-
91
-
92
-
93
-
94
-
95
-
96
-
97
-
98
-
99
-
100
-
101
-
102
-
103
-
104
-
105
-
106
-
107
-
108
-
109
-
110
-
111
-
112
-
113
-
114
-
115
-
116
-
117
-
118
-
119
-
120
-
121
-
122
-
123
-
124
-
125
-
126
-
127
-
128
-
129
-
130
-
131
-
132
-
133
-
134
-
135
-
136
-
137
-
138
-
139
-
140
-
141
-
142
-
143
-
144
-
145
-
146
 |
 |

1
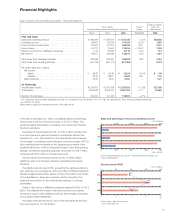
Financial Highlights
20 468
500 100 150 200
2004
2005
2006
3.8%
4.1%
6.2%
Net income and ROE
(Yen in billions)
(%)
■ Net income ● Return on equity
* Years ended March 31
Dollars in millions*
Yen in millions Percent except per
except per share amounts and number of employees change share amounts
2004 2005 2006 2006/2005 2006
FOR THE YEAR
Sales and operating revenue . . . . . . . . . . . . . . . . . . . . . . . . . .
¥7,496,391 ¥7,159,616 ¥ 7,475,436 +4.4.%$63,893
Operating income . . . . . . . . . . . . . . . . . . . . . . . . . . . . . . . . . .
98,902 113,919 191,255 +67.9.1,635
Income before income taxes . . . . . . . . . . . . . . . . . . . . . . . . . .
144,067 157,207 286,329 +82.1.2,447
Income taxes . . . . . . . . . . . . . . . . . . . . . . . . . . . . . . . . . . . . . .
52,774 16,044 176,515 +1,000.2.1,508
Equity in net income of affiliated companies . . . . . . . . . . . . . . .
1,714 29,039 13,176 –54.6.113
Net income . . . . . . . . . . . . . . . . . . . . . . . . . . . . . . . . . . . . . . .
88,511 163,838 123,616 –24.5.1,057
Cash flows from operating activities . . . . . . . . . . . . . . . . . . . . .
632,635 646,997 399,858 –38.2.3,418
Cash flows from investing activities . . . . . . . . . . . . . . . . . . . . .
(761,792) (931,172) (871,264) —(7,447)
Per share data: (Yen, dollars)
Net income
—Basic . . . . . . . . . . . . . . . . . . . . . . . . . . . . . . . . . . . . . .
¥ 95.97.¥ 175.90.¥ 122.58.–30.3.%$ 1.05.
—Diluted . . . . . . . . . . . . . . . . . . . . . . . . . . . . . . . . . . . . .
87.00.158.07.116.88.–26.1.1.00.
Cash dividends . . . . . . . . . . . . . . . . . . . . . . . . . . . . . . . . . .
25.00.25.00.25.00.
—
0.21.
AT YEAR-END
Stockholders’ equity . . . . . . . . . . . . . . . . . . . . . . . . . . . . . . . .
¥2,378,002 ¥2,870,338 ¥ 3,203,852 +11.6.%$27,383
Total assets . . . . . . . . . . . . . . . . . . . . . . . . . . . . . . . . . . . . . . .
9,090,662 9,499,100 10,607,753 +11.7.90,665
Number of employees . . . . . . . . . . . . . . . . . . . . . . . . . . . . . . .
162,000 151,400 158,500 +4.7.%
* U.S. dollar amounts have been translated from yen, for convenience only, at the rate of ¥117=U.S.$1, the approximate Tokyo foreign exchange market rate
as of March 31, 2006.
Please refer to page 80 for detailed footnotes to the table above.
In the year ended March 31, 2006, consolidated sales and operating
revenue rose 4.4% from the previous year, to ¥7,475.4 billion. This
result was largely attributable to increases in the Game and Financial
Services businesses.
Operating income increased 67.9%, to ¥191.3 billion, primarily due
to an improvement in gains and losses on investments at Sony Life
Insurance Co., Ltd., accounted for in the Financial Services business.
The increase in operating income included a one-time net gain of ¥73.5
billion resulting from the transfer to the Japanese government of the
substitutional portion of Sony’s Employee Pension Fund. Restructuring
charges, recorded as operating expenses, amounted to ¥138.7 billion,
compared with ¥90.0 billion in the previous period.
Income before income taxes climbed 82.1%, to ¥286.3 billion,
reflecting a gain on a change in interest in subsidiaries and equity
investees.
The effective tax rate was 61.6%, exceeding the Japanese statutory
rate, primarily as a consequence of the recording of additional valuation
allowance against deferred tax assets by Sony Corporation and certain
of its subsidiaries in Japan and overseas, and the recording of an
additional tax provision for the undistributed earnings of overseas
subsidiaries.
Equity in net income of affiliated companies declined 54.6%, to ¥13.2
billion. This reflected the impact in the previous period of proceeds
recorded by equity-method affiliate InterTrust Technologies Corporation
from a patent-related settlement.
As a result of the above factors, net income decreased 24.5% from
the previous period, to ¥123.6 billion.
Sony Corporation and Consolidated Subsidiaries—Years ended March 31
2000 400 600 800
2,0000 4,000 6,000 8,000
2004
2005
2006
Sales and operating revenue and operating income
■ Sales and operating revenue (top axis) ■ Operating income (bottom axis)
* Years ended March 31
(Yen in billions)
(Yen in billions)