Sony 2006 Annual Report Download - page 57
Download and view the complete annual report
Please find page 57 of the 2006 Sony annual report below. You can navigate through the pages in the report by either clicking on the pages listed below, or by using the keyword search tool below to find specific information within the annual report.-
 1
1 -
2
-
3
-
4
-
5
-
6
-
7
-
8
-
9
-
10
-
11
-
12
-
13
-
14
-
15
-
16
-
17
-
18
-
19
-
20
-
21
-
22
-
23
-
24
-
25
-
26
-
27
-
28
-
29
-
30
-
31
-
32
-
33
-
34
-
35
-
36
-
37
-
38
-
39
-
40
-
41
-
42
-
43
-
44
-
45
-
46
-
 47
47 -
 48
48 -
 49
49 -
 50
50 -
 51
51 -
 52
52 -
 53
53 -
 54
54 -
 55
55 -
 56
56 -
 57
57 -
 58
58 -
 59
59 -
 60
60 -
 61
61 -
 62
62 -
 63
63 -
 64
64 -
 65
65 -
 66
66 -
 67
67 -
68
-
69
-
70
-
71
-
72
-
73
-
74
-
75
-
76
-
77
-
78
-
79
-
80
-
81
-
82
-
83
-
84
-
85
-
86
-
87
-
88
-
89
-
90
-
91
-
92
-
93
-
94
-
95
-
96
-
97
-
98
-
99
-
100
-
101
-
102
-
103
-
104
-
105
-
106
-
107
-
108
-
109
-
110
-
111
-
112
-
113
-
114
-
115
-
116
-
117
-
118
-
119
-
120
-
121
-
122
-
123
-
124
-
125
-
126
-
127
-
128
-
129
-
130
-
131
-
132
-
133
-
134
-
135
-
136
-
137
-
138
-
139
-
140
-
141
-
142
-
143
-
144
-
145
-
146
 |
 |

55
2.3%, compared to 21.0% in the previous fiscal year, to 18.7%,
as a result of the sales increase.
Charges related to the launch of the PS3 platform are
anticipated to result in a significant loss within the Game
segment for the fiscal year ending March 31, 2007, reflecting
primarily an expected negative margin as a result of strategic
pricing on PS3 hardware sales.
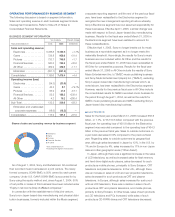
■PICTURES
Sales for the fiscal year ended March 31, 2006 increased by
¥12.2 billion, or 1.7%, to ¥745.9 billion compared with the previ-
ous fiscal year. Operating income decreased by ¥36.5 billion,
or 57.1%, to ¥27.4 billion, and the operating income margin
decreased from 8.7% to 3.7%. The results in the Pictures
segment consist of the results of Sony Pictures Entertainment Inc.
(“SPE”), a U.S.-based subsidiary.
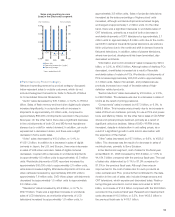
On a U.S. dollar basis, sales for the fiscal year in the Pictures
segment decreased approximately 4% and operating income
decreased by approximately 61%. Sales decreased primarily
due to lower worldwide theatrical and home entertainment
revenues on feature films, partially offset by an increase in
television product revenues. The lower theatrical
and home entertainment revenues primarily resulted from the
strong performance of Spider-Man 2 in the prior fiscal year
coupled with the disappointing performance of certain films in
the current fiscal year film slate, particularly Stealth, Zathura
and the Legend of Zorro. Sales for the fiscal year release slate
decreased $967 million as compared to the previous fiscal year.
Television product revenues increased by approximately $220
million primarily due to higher advertising and subscription sales
from several of SPE’s international channels, higher sales of
television library product and the extension of a licensing
agreement for Wheel of Fortune.
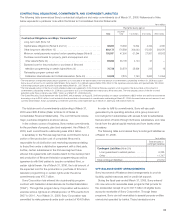
■GAME
Sales for the fiscal year ended March 31, 2006 increased by
¥228.9 billion, or 31.4%, to ¥958.6 billion compared with the
previous fiscal year. Operating income decreased by ¥34.4
billion, or 79.7%, to ¥8.7 billion compared with the previous
fiscal year, and the operating income margin decreased from
5.9% to 0.9%.
Sales in the Game segment on a local currency basis increased
approximately 27%. In addition, on a local currency basis,
operating income decreased approximately 62% compared to
the previous fiscal year. By region, although sales decreased
slightly in Japan, there was a significant increase in sales in the
U.S. and Europe.
There was a significant increase in hardware sales compared
to the previous fiscal year. Sales increased significantly, mainly
in the U.S. and Europe, and sales in Japan remained relatively
unchanged compared to the previous fiscal year, primarily due
to a significant contribution to sales from PSP, which experienced
favorable growth in all geographic areas and the fact that
PlayStation®2 (“PS2”) sales were on a par with those in the
previous fiscal year. In addition, although PS2 software sales
decreased, as a result of the contribution to sales from PSP
software, software sales in Japan, the U.S. and Europe were
relatively unchanged compared to the previous fiscal year.
Total worldwide production shipments of hardware and
software were as follows:
Worldwide hardware production shipments:*
PS2 . . . 16.22 million units (an increase of 0.05 million units)
PSP . . . 14.06 million units (an increase of 11.09 million units)
Worldwide software production shipments:*/**
PS2 . . . 223 million units (a decrease of 29 million units)
PSP . . . 41.6 million units (an increase of 35.9 million units)
*Production shipments of hardware and software are counted upon shipment of
the products from manufacturing bases. Sales of such products are recognized
when the products are delivered to customers.
** Including those both from Sony and third parties under Sony licenses.
Operating income decreased significantly compared with the
previous fiscal year. Although profits from the PS2 and PSP
businesses exceeded those in the previous fiscal year, the
decrease in operating income was mainly the result of continued
high research and development costs associated with PS3, as
well as the recording of charges associated with preparation
for the launch of the PS3 platform including a write-down of
approximately ¥25.0 billion for semiconductor components for
use in PS3.
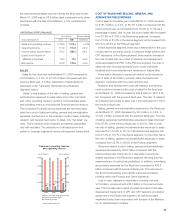
The cost of sales to sales ratio deteriorated by 7.4%, from
73.0% in the previous fiscal year, to 80.4% for the reasons
mentioned above for operating income. The ratio of selling,
general and administrative expenses to sales decreased by
(Yen in billions)
Sales and operating income
in the Game segment
■ Sales (left)
■ Operating income (right)
● Operating margin
*Years ended March 31
1,200
900
600
300
0
240
180
120
60
0
2004 2005 2006
8.7%
5.9%
0.9%
(Yen in billions)