Sony 2006 Annual Report Download - page 70
Download and view the complete annual report
Please find page 70 of the 2006 Sony annual report below. You can navigate through the pages in the report by either clicking on the pages listed below, or by using the keyword search tool below to find specific information within the annual report.-
 1
1 -
2
-
3
-
4
-
5
-
6
-
7
-
8
-
9
-
10
-
11
-
12
-
13
-
14
-
15
-
16
-
17
-
18
-
19
-
20
-
21
-
22
-
23
-
24
-
25
-
26
-
27
-
28
-
29
-
30
-
31
-
32
-
33
-
34
-
35
-
36
-
37
-
38
-
39
-
40
-
41
-
42
-
43
-
44
-
45
-
46
-
47
-
48
-
49
-
50
-
51
-
52
-
53
-
54
-
55
-
56
-
57
-
58
-
59
-
 60
60 -
 61
61 -
 62
62 -
 63
63 -
 64
64 -
 65
65 -
 66
66 -
 67
67 -
 68
68 -
 69
69 -
 70
70 -
 71
71 -
 72
72 -
 73
73 -
 74
74 -
 75
75 -
 76
76 -
 77
77 -
 78
78 -
 79
79 -
 80
80 -
81
-
82
-
83
-
84
-
85
-
86
-
87
-
88
-
89
-
90
-
91
-
92
-
93
-
94
-
95
-
96
-
97
-
98
-
99
-
100
-
101
-
102
-
103
-
104
-
105
-
106
-
107
-
108
-
109
-
110
-
111
-
112
-
113
-
114
-
115
-
116
-
117
-
118
-
119
-
120
-
121
-
122
-
123
-
124
-
125
-
126
-
127
-
128
-
129
-
130
-
131
-
132
-
133
-
134
-
135
-
136
-
137
-
138
-
139
-
140
-
141
-
142
-
143
-
144
-
145
-
146
 |
 |

68
MARKET ACCESS
Sony Corporation and SGTS, a finance subsidiary in the U.K.,
procure funds from the financial and capital markets.
In order to meet long-term funding requirements, Sony
Corporation utilizes its access to global equity and bond
markets. During the fiscal year ended March 31, 2006, based
on a bond shelf registration filed in Japan, Sony issued three
series of straight bonds totaling ¥120 billion in September 2005
for the purpose of debt redemption, and another three series of
straight bonds totaling ¥100 billion in February 2006 for the
redemption bonds maturing during the fiscal year ending March 31,
2007, respectively. As the total amount of shelf registrations
outstanding decreased after these bond issues, Sony filed a
new shelf registration of ¥300 billion in April 2006, which is
effective for two years.
In order to meet the working capital requirements of Sony,
SGTS maintains commercial paper (“CP”) programs and a
medium-term note (“MTN”) program. SGTS maintains CP
programs for the U.S., Euro and Japanese CP markets. As of
March 31, 2006, the total amount of these CP programs was
¥1,321.9 billion. During the fiscal year ended March 31, 2006,
the largest month-end outstanding balance of CP was ¥111.4
billion in September 2005. There was no outstanding balance of
CP as of March 31, 2006.
SGTS maintains a Euro MTN program of whose amount as of
March 31, 2006 was ¥587.1 billion. There was no outstanding
balance as of March 31, 2006. Sony Capital Corporation
(“SCC”), a Sony finance subsidiary in the U.S., had an outstand-
ing MTN balance of approximately ¥58.7 billion as of March 31,
2006. However, Sony does not intend to utilize SCC’s program
for future financing requirements as SCC’s financing function
was integrated into that of SGTS.
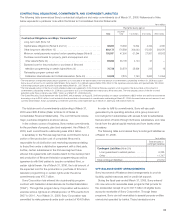
other segments, Sony believes that a comparative presentation
may be useful in understanding and analyzing Sony’s consoli-
dated financial statements. Transactions between the Financial
CONDENSED STATEMENTS OF CASH FLOWS
Yen in millions
Sony without
Financial Services Financial Services Consolidated
Years ended March 31 2005 2006 2005 2006 2005 2006
Net cash provided by operating activities . . . . . . . . . . . . . . . . . . .
168,078 147,149 485,439 251,975 646,997 399,858
Net cash used in investing activities . . . . . . . . . . . . . . . . . . . . . . .
(421,384) (563,753) (472,119) (296,376) (931,172) (871,264)
Net cash provided by (used in) financing activities . . . . . . . . . . . .
256,361 274,863 (95,373) 74,600 205,177 359,864
Effect of exchange rate changes on cash and cash equivalents . .
——8,890 35,537 8,890 35,537
Net increase (decrease) in cash and cash equivalents . . . . . . . . .
3,055 (141,741) (73,163) 65,736 (70,108) (76,005)
Cash and cash equivalents at beginning of the fiscal year . . . . . .
256,316 259,371 592,895 519,732 849,211 779,103
Cash and cash equivalents at end of the fiscal year . . . . . . . . . . .
259,371 117,630 519,732 585,468 779,103 703,098
LIQUIDITY AND CAPITAL RESOURCES
Sony’s financial policy is to secure adequate liquidity, to ensure
the smooth financing of its operations and to maintain the
strength of its balance sheet.
Sony intends to continue both structural reform and various
investments for future growth. Sony believes that it can maintain
sufficient liquidity and financial flexibility to satisfy its various
capital needs, including funding requirements that arise from its
business strategy, working capital needs, repayment of existing
debt, payment of dividends and all its other capital needs,
through cash flows and cash and cash equivalents, its ability to
procure necessary funds from the financial and capital markets,
its commitment lines with banks, and other means.
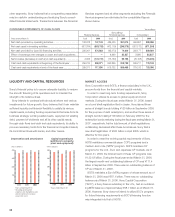
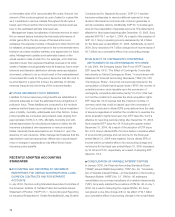
(Yen in billions)
Depreciation and amortization
*Years ended March 31
*Including amortization
expenses for intangible assets
and for deferred insurance
acquisition costs
400
300
200
100
02004 2005 2006
Capital expenditures
(additions to property,
plant and equipment)
*Years ended March 31
(Yen in billions)
400
300
200
100
02004 2005 2006
Services segment and all other segments excluding the Financial
Services segment are eliminated in the consolidated figures
shown below.