Sony 2006 Annual Report Download - page 107
Download and view the complete annual report
Please find page 107 of the 2006 Sony annual report below. You can navigate through the pages in the report by either clicking on the pages listed below, or by using the keyword search tool below to find specific information within the annual report.-
 1
1 -
2
-
3
-
4
-
5
-
6
-
7
-
8
-
9
-
10
-
11
-
12
-
13
-
14
-
15
-
16
-
17
-
18
-
19
-
20
-
21
-
22
-
23
-
24
-
25
-
26
-
27
-
28
-
29
-
30
-
31
-
32
-
33
-
34
-
35
-
36
-
37
-
38
-
39
-
40
-
41
-
42
-
43
-
44
-
45
-
46
-
47
-
48
-
49
-
50
-
51
-
52
-
53
-
54
-
55
-
56
-
57
-
58
-
59
-
60
-
61
-
62
-
63
-
64
-
65
-
66
-
67
-
68
-
69
-
70
-
71
-
72
-
73
-
74
-
75
-
76
-
77
-
78
-
79
-
80
-
81
-
82
-
83
-
84
-
85
-
86
-
87
-
88
-
89
-
90
-
91
-
92
-
93
-
94
-
95
-
96
-
 97
97 -
 98
98 -
 99
99 -
 100
100 -
 101
101 -
 102
102 -
 103
103 -
 104
104 -
 105
105 -
 106
106 -
 107
107 -
 108
108 -
 109
109 -
 110
110 -
 111
111 -
 112
112 -
 113
113 -
 114
114 -
 115
115 -
 116
116 -
 117
117 -
118
-
119
-
120
-
121
-
122
-
123
-
124
-
125
-
126
-
127
-
128
-
129
-
130
-
131
-
132
-
133
-
134
-
135
-
136
-
137
-
138
-
139
-
140
-
141
-
142
-
143
-
144
-
145
-
146
 |
 |

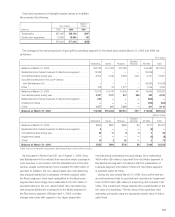
105
impairment of the investment is recognized and the carrying
value is reduced to its fair value.
For the fiscal years ended March 31, 2004, 2005 and 2006,
Sony booked ¥4,988 million, ¥5,696 million and ¥45,092 million
($385 million) of net unrealized gain on trading securities prima-
rily in the life insurance business.
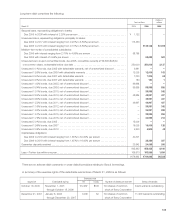
aggregate carrying amounts of the investments in non-public
companies at March 31, 2005 and 2006, were ¥48,877 million
and ¥59,575 million ($509 million), respectively. Non-public
equity investments are valued at cost as fair value is not readily
determinable. If the value is estimated to have declined and
such decline is judged to be other than temporary, the
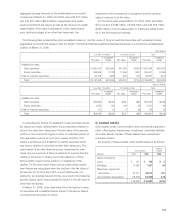
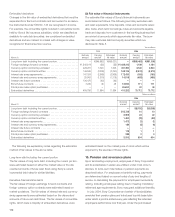
The following table presents the gross unrealized losses on, and fair value of, Sony’s investment securities with unrealized losses,
aggregated by investment category and the length of time that individual investment securities have been in a continuous unrealized loss
position, at March 31, 2006.
Yen in millions
Less than 12 months 12 months or more Total
Unrealized Unrealized Unrealized
Fair value losses Fair value losses Fair value losses
Available-for-sale:
Debt securities . . . . . . . . . . . . . . . . . . . . . . . . . . . . . . . . . . . . .
¥1,860,204 ¥(22,590) ¥21,250 ¥(220) ¥1,881,454 ¥(22,810)
Equity securities . . . . . . . . . . . . . . . . . . . . . . . . . . . . . . . . . . . .
266,946 (1,108) 17,495 (481) 284,441 (1,589)
Held-to-maturity securities . . . . . . . . . . . . . . . . . . . . . . . . . . . . . .
20,278 (208) 629 (13) 20,907 (221)
Total . . . . . . . . . . . . . . . . . . . . . . . . . . . . . . . . . . . . . . . . . . . . .
¥2,147,428 ¥(23,906) ¥39,374 ¥(714) ¥2,186,802 ¥(24,620)
Dollars in millions
Less than 12 months 12 months or more Total
Unrealized Unrealized Unrealized
Fair value losses Fair value losses Fair value losses
Available-for-sale:
Debt securities . . . . . . . . . . . . . . . . . . . . . . . . . . . . . . . . . . . . .
$15,899 $(193) $182 $(2) $16,081 $(195)
Equity securities . . . . . . . . . . . . . . . . . . . . . . . . . . . . . . . . . . . .
2,282 (10) 149 (4) 2,431 (14)
Held-to-maturity securities . . . . . . . . . . . . . . . . . . . . . . . . . . . . . .
173 (1) 6 (0) 179 (1)
Total . . . . . . . . . . . . . . . . . . . . . . . . . . . . . . . . . . . . . . . . . . . . .
$18,354 $(204) $337 $(6) $18,691 $(210)
In evaluating the factors for available-for-sale securities whose
fair values are readily determinable, Sony presumes a decline in
value to be other-than-temporary if the fair value of the security
is 20% or more below its original cost for an extended period of
time (generally a period of up to six to twelve months). This
criteria is employed as a threshold to identify securities which
may have a decline in value that is other-than-temporary. The
presumption of an other-than-temporary impairment in such
cases may be overcome if there is evidence to support that the
decline is temporary in nature due to the existence of other
factors which overcome the duration or magnitude of the
decline. On the other hand, there may be cases where impair-
ment losses are recognized when the decline in the fair value of
the security is not more than 20% or such decline has not
existed for an extended period of time, as a result of considering
specific factors which may indicate the decline in the fair value is
other-than-temporary.
At March 31, 2006, Sony determined that the decline in value
for securities with unrealized losses shown in the above table is
not other-than-temporary in nature.
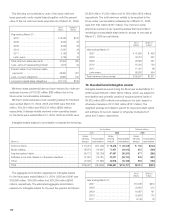
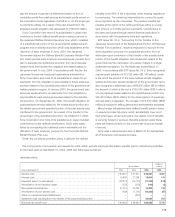
9. Leased assets
Sony leases certain communication and commercial equipment,
plant, office space, warehouses, employees’ residential facilities
and other assets. Certain of these leases have renewal and
purchase options.
An analysis of leased assets under capital leases is as follows:
Dollars in
Yen in millions millions
March 31 2005 2006 2006
Class of property:
Land . . . . . . . . . . . . . . . . . .
¥ 181 ¥ 193 $ 2
Buildings . . . . . . . . . . . . . . .
11,089 7,437 64
Machinery, equipment
and others . . . . . . . . . . . . .
33,747 28,870 247
Accumulated depreciation . .
(18,509) (14,820) (128)
. . . . . . . . . . . . . . . . . . . .
¥ 26,508 ¥ 21,680 $ 185