Sony 2006 Annual Report Download - page 50
Download and view the complete annual report
Please find page 50 of the 2006 Sony annual report below. You can navigate through the pages in the report by either clicking on the pages listed below, or by using the keyword search tool below to find specific information within the annual report.-
 1
1 -
2
-
3
-
4
-
5
-
6
-
7
-
8
-
9
-
10
-
11
-
12
-
13
-
14
-
15
-
16
-
17
-
18
-
19
-
20
-
21
-
22
-
23
-
24
-
25
-
26
-
27
-
28
-
29
-
30
-
31
-
32
-
33
-
34
-
35
-
36
-
37
-
38
-
39
-
 40
40 -
 41
41 -
 42
42 -
 43
43 -
 44
44 -
 45
45 -
 46
46 -
 47
47 -
 48
48 -
 49
49 -
 50
50 -
 51
51 -
 52
52 -
 53
53 -
 54
54 -
 55
55 -
 56
56 -
 57
57 -
 58
58 -
 59
59 -
 60
60 -
61
-
62
-
63
-
64
-
65
-
66
-
67
-
68
-
69
-
70
-
71
-
72
-
73
-
74
-
75
-
76
-
77
-
78
-
79
-
80
-
81
-
82
-
83
-
84
-
85
-
86
-
87
-
88
-
89
-
90
-
91
-
92
-
93
-
94
-
95
-
96
-
97
-
98
-
99
-
100
-
101
-
102
-
103
-
104
-
105
-
106
-
107
-
108
-
109
-
110
-
111
-
112
-
113
-
114
-
115
-
116
-
117
-
118
-
119
-
120
-
121
-
122
-
123
-
124
-
125
-
126
-
127
-
128
-
129
-
130
-
131
-
132
-
133
-
134
-
135
-
136
-
137
-
138
-
139
-
140
-
141
-
142
-
143
-
144
-
145
-
146
 |
 |
48
OPERATING RESULTS
Operating Results for the Fiscal Year Ended March 31, 2006
compared with the Fiscal Year Ended March 31, 2005
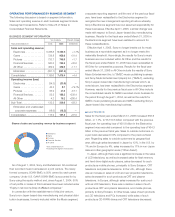
OVERVIEW
After translation of Sony’s financial results into yen (the currency
in which Sony’s financial statements are prepared), in accordance
with Generally Accepted Accounting Principles in the U.S. (“U.S.
GAAP”), Sony’s sales and operating revenue (“sales”) for the fiscal
year ended March 31, 2006 increased 4.4% compared with the
previous fiscal year. On a local currency basis (regarding refer-
ences to results of operations expressed on a local currency
basis, refer to “Foreign Exchange Fluctuations and Risk Hedging”
below), sales for the fiscal year increased slightly. The 4.4%
increase is mainly due to an increase in revenues within the
Financial Services segment, as a result of an improvement in gains
and losses on investments at Sony Life Insurance Co., Ltd. (“Sony
Life”) due to the favorable Japanese domestic equity market
conditions, and increased sales within the Game segment, as
the result of the contribution from PSP® (PlayStation®Portable)
(“PSP”). In the Electronics segment, although sales benefited
from the depreciation of the yen and there was an increase in
sales of liquid crystal display (“LCD”) televisions, sales to outside
customers decreased 0.9% compared with the previous fiscal
year. There was a decline in sales of CRT televisions, due to a con-
tinued shift in demand towards flat panel televisions, and in plasma
televisions, where new product development has been terminated.
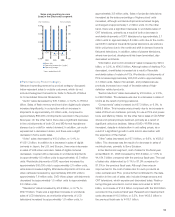
Operating income increased 67.9% compared with the
previous fiscal year. On a local currency basis, operating income
increased approximately 23% compared with the previous fiscal
year. Operating income includes a one-time net gain of
¥73.5 billion, which resulted from the transfer to the Japanese
Government of the substitutional portion of Sony’s Employee
Pension Fund. Of this, a gain of ¥64.5 billion was recorded
within the Electronics segment. In the Financial Services segment,
operating income increased due to an improvement in gains and
losses on investments at Sony Life resulting from the above-
mentioned favorable Japanese domestic equity market conditions.
In the Electronics segment, although restructuring charges increased
compared with the previous fiscal year, the amount of operating
loss decreased as a result of a net gain resulting from the transfer
to the Japanese Government of the substitutional portion of Sony’s
Employee Pension Fund mentioned above and favorable exchange
rates. Operating income within the Game segment declined prima-
rily as a result of an increase in research and development costs
associated mainly with PLAYSTATION®3 (“PS3”). In the Pictures
segment, operating income also declined due to lower worldwide
theatrical and home entertainment revenues on feature films.
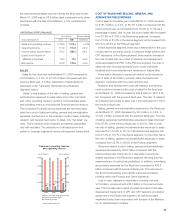
RESTRUCTURING
In the fiscal year ended March 31, 2006, Sony recorded
restructuring charges of ¥138.7 billion, a increase from the
¥90.0 billion recorded in the previous fiscal year. The primary
restructuring activities were in the Electronics segment and
All Other.
Of the total ¥138.7 billion, Sony recorded ¥48.3 billion in
personnel-related costs. This expense was incurred because
5,700 people, mainly in Japan, the U.S. and Western Europe,
left Sony primarily through early retirement programs.
For more detailed information about restructuring, please refer
to Note 18 of Notes to the Consolidated Financial Statements.
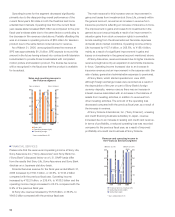
■ELECTRONICS
Restructuring charges in the Electronics segment for the fiscal
year ended March 31, 2006 were ¥125.8 billion, compared to
¥83.2 billion in the previous fiscal year.
Due to the worldwide market shrinkage and demand shift
from CRT television to plasma and LCD panel television, Sony
has been implementing a worldwide plan to rationalize CRT and
CRT television production facilities and has been downsizing its
business over several years. In the fiscal year ended March 31,
2006, as part of this restructuring program, Sony recorded a
non-cash impairment charge of ¥25.5 billion for CRT TV display
manufacturing facilities located in the U.S. The impairment
charge was calculated as the difference between the carrying
value of the asset group and the present value of estimated
future cash flows. The charge was recorded in loss on sale,
disposal or impairment of assets, net in the consolidated
statements of income.
In addition to the above restructuring efforts, Sony undertook
several headcount reduction programs to further reduce operating
costs in the Electronics segment. As a result of these programs,
Sony recorded restructuring charges of ¥45.1 billion for the
fiscal year ended March 31, 2006, and these charges were
included in selling, general and administrative expenses in the
consolidated statements of income. These staff reductions
were achieved worldwide mostly through the implementation of
early retirement programs. The remaining liability balance as of
March 31, 2006 was ¥19.4 billion and will be paid through the
fiscal year ending March 31, 2007. Sony will continue seeking the
appropriate headcount level to optimize the workforce in the
Electronics segment.
■ALL OTHER
Restructuring charges within All Other for the fiscal year ended
March 31, 2006 were ¥10.4 billion, compared to ¥5.3 billion
recorded in the previous fiscal year. The main component of
Operating and Financial Review
Sony Corporation and Consolidated Subsidiaries