Sony 2006 Annual Report Download - page 136
Download and view the complete annual report
Please find page 136 of the 2006 Sony annual report below. You can navigate through the pages in the report by either clicking on the pages listed below, or by using the keyword search tool below to find specific information within the annual report.-
 1
1 -
2
-
3
-
4
-
5
-
6
-
7
-
8
-
9
-
10
-
11
-
12
-
13
-
14
-
15
-
16
-
17
-
18
-
19
-
20
-
21
-
22
-
23
-
24
-
25
-
26
-
27
-
28
-
29
-
30
-
31
-
32
-
33
-
34
-
35
-
36
-
37
-
38
-
39
-
40
-
41
-
42
-
43
-
44
-
45
-
46
-
47
-
48
-
49
-
50
-
51
-
52
-
53
-
54
-
55
-
56
-
57
-
58
-
59
-
60
-
61
-
62
-
63
-
64
-
65
-
66
-
67
-
68
-
69
-
70
-
71
-
72
-
73
-
74
-
75
-
76
-
77
-
78
-
79
-
80
-
81
-
82
-
83
-
84
-
85
-
86
-
87
-
88
-
89
-
90
-
91
-
92
-
93
-
94
-
95
-
96
-
97
-
98
-
99
-
100
-
101
-
102
-
103
-
104
-
105
-
106
-
107
-
108
-
109
-
110
-
111
-
112
-
113
-
114
-
115
-
116
-
117
-
118
-
119
-
120
-
121
-
122
-
123
-
124
-
125
-
 126
126 -
 127
127 -
 128
128 -
 129
129 -
 130
130 -
 131
131 -
 132
132 -
 133
133 -
 134
134 -
 135
135 -
 136
136 -
 137
137 -
 138
138 -
 139
139 -
 140
140 -
 141
141 -
 142
142 -
 143
143 -
 144
144 -
 145
145 -
 146
146
 |
 |

134
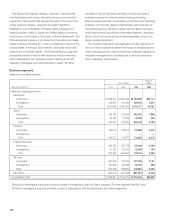
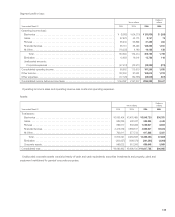
Business segments
Sales and operating revenue:
Dollars in
Yen in millions millions
Years ended March 31 2004 2005 2006 2006
Sales and operating revenue:
Electronics
Customers . . . . . . . . . . . . . . . . . . . . . . . . . . . . . . . . . . . . . . . . . . . . . . . . . . . . . . . . .
¥4,858,631 ¥4,806,494 ¥4,763,555 $40,714
Intersegment . . . . . . . . . . . . . . . . . . . . . . . . . . . . . . . . . . . . . . . . . . . . . . . . . . . . . . .
228,834 260,339 386,922 3,307
Total . . . . . . . . . . . . . . . . . . . . . . . . . . . . . . . . . . . . . . . . . . . . . . . . . . . . . . . . . . . .
5,087,465 5,066,833 5,150,477 44,021
Game
Customers . . . . . . . . . . . . . . . . . . . . . . . . . . . . . . . . . . . . . . . . . . . . . . . . . . . . . . . . .
753,732 702,524 918,251 7,848
Intersegment . . . . . . . . . . . . . . . . . . . . . . . . . . . . . . . . . . . . . . . . . . . . . . . . . . . . . . .
26,488 27,230 40,368 345
Total . . . . . . . . . . . . . . . . . . . . . . . . . . . . . . . . . . . . . . . . . . . . . . . . . . . . . . . . . . . .
780,220 729,754 958,619 8,193
Pictures
Customers . . . . . . . . . . . . . . . . . . . . . . . . . . . . . . . . . . . . . . . . . . . . . . . . . . . . . . . . .
756,370 733,677 745,859 6,375
Intersegment . . . . . . . . . . . . . . . . . . . . . . . . . . . . . . . . . . . . . . . . . . . . . . . . . . . . . . .
————
Total . . . . . . . . . . . . . . . . . . . . . . . . . . . . . . . . . . . . . . . . . . . . . . . . . . . . . . . . . . . .
756,370 733,677 745,859 6,375
Financial Services
Customers . . . . . . . . . . . . . . . . . . . . . . . . . . . . . . . . . . . . . . . . . . . . . . . . . . . . . . . . .
565,752 537,715 720,566 6,159
Intersegment . . . . . . . . . . . . . . . . . . . . . . . . . . . . . . . . . . . . . . . . . . . . . . . . . . . . . . .
27,792 22,842 22,649 194
Total . . . . . . . . . . . . . . . . . . . . . . . . . . . . . . . . . . . . . . . . . . . . . . . . . . . . . . . . . . . .
593,544 560,557 743,215 6,353
All Other
Customers . . . . . . . . . . . . . . . . . . . . . . . . . . . . . . . . . . . . . . . . . . . . . . . . . . . . . . . . .
561,906 379,206 327,205 2,797
Intersegment . . . . . . . . . . . . . . . . . . . . . . . . . . . . . . . . . . . . . . . . . . . . . . . . . . . . . . .
100,903 80,688 81,676 698
Total . . . . . . . . . . . . . . . . . . . . . . . . . . . . . . . . . . . . . . . . . . . . . . . . . . . . . . . . . . . . . .
662,809 459,894 408,881 3,495
Elimination . . . . . . . . . . . . . . . . . . . . . . . . . . . . . . . . . . . . . . . . . . . . . . . . . . . . . . . . . . .
(384,017) (391,099) (531,615) (4,544)
Consolidated total . . . . . . . . . . . . . . . . . . . . . . . . . . . . . . . . . . . . . . . . . . . . . . . . . . . . . . .
¥7,496,391 ¥7,159,616 ¥7,475,436 $63,893
Electronics intersegment amounts primarily consist of transactions with the Game segment, Pictures segment and All Other.
All Other intersegment amounts primarily consist of transactions with the Electronics and Game segments.
The Electronics segment designs, develops, manufactures
and distributes audio-visual, informational and communicative
equipment, instruments and devices throughout the world. The
Game segment designs, develops and sells PlayStation,
PlayStation 2 and PlayStation Portable game consoles and
related software mainly in Japan, the United States of America
and Europe, and licenses to third party software developers. The
Pictures segment develops, produces and manufactures image-
based software, including film, video, and television mainly in the
United States of America, and markets, distributes and broad-
casts in the worldwide market. The Financial Services segment
represents primarily individual life insurance and non-life insur-
ance businesses in the Japanese market, leasing and credit
financing businesses and bank business in Japan. All Other
consists of various operating activities, primarily including a
business focused on network service business including
Internet-related services, an animation production and marketing
business, an imported general merchandise retail business, an
advertising agency business in Japan, and the Music business,
which was formerly reported as a reportable segment, described
above. Sony’s products and services are generally unique to a
single operating segment.
The operating segments reported below are the segments of
Sony for which separate financial information is available and for
which operating profit or loss amounts are evaluated regularly by
executive management in deciding how to allocate resources
and in assessing performance.