Sony 2006 Annual Report Download - page 62
Download and view the complete annual report
Please find page 62 of the 2006 Sony annual report below. You can navigate through the pages in the report by either clicking on the pages listed below, or by using the keyword search tool below to find specific information within the annual report.-
 1
1 -
2
-
3
-
4
-
5
-
6
-
7
-
8
-
9
-
10
-
11
-
12
-
13
-
14
-
15
-
16
-
17
-
18
-
19
-
20
-
21
-
22
-
23
-
24
-
25
-
26
-
27
-
28
-
29
-
30
-
31
-
32
-
33
-
34
-
35
-
36
-
37
-
38
-
39
-
40
-
41
-
42
-
43
-
44
-
45
-
46
-
47
-
48
-
49
-
50
-
51
-
 52
52 -
 53
53 -
 54
54 -
 55
55 -
 56
56 -
 57
57 -
 58
58 -
 59
59 -
 60
60 -
 61
61 -
 62
62 -
 63
63 -
 64
64 -
 65
65 -
 66
66 -
 67
67 -
 68
68 -
 69
69 -
 70
70 -
 71
71 -
 72
72 -
73
-
74
-
75
-
76
-
77
-
78
-
79
-
80
-
81
-
82
-
83
-
84
-
85
-
86
-
87
-
88
-
89
-
90
-
91
-
92
-
93
-
94
-
95
-
96
-
97
-
98
-
99
-
100
-
101
-
102
-
103
-
104
-
105
-
106
-
107
-
108
-
109
-
110
-
111
-
112
-
113
-
114
-
115
-
116
-
117
-
118
-
119
-
120
-
121
-
122
-
123
-
124
-
125
-
126
-
127
-
128
-
129
-
130
-
131
-
132
-
133
-
134
-
135
-
136
-
137
-
138
-
139
-
140
-
141
-
142
-
143
-
144
-
145
-
146
 |
 |
60
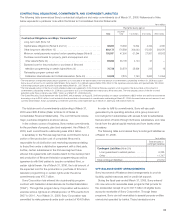
■PROPERTY, PLANT AND EQUIPMENT (AFTER DEDUCTION
OF ACCUMULATED DEPRECIATION)
Property, plant and equipment on March 31, 2006 increased by
¥16.1 billion, or 1.2%, to ¥1,388.5 billion, compared with the
previous fiscal year-end.
Property, plant and equipment on March 31, 2006 in all
segments excluding the Financial Services segment increased
by ¥17.3 billion, or 1.3%, to ¥1,351.1 billion, compared with the
previous fiscal year-end.
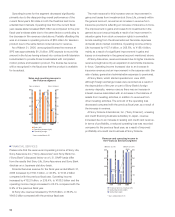
Capital expenditures (part of the increase in property, plant
and equipment) for the fiscal year ended March 31, 2006
increased by ¥27.5 billion, or 7.7%, to ¥384.3 billion compared
with the previous fiscal year. Capital expenditures in the
Electronics segment increased by ¥17.5 billion, or 5.6%, to
¥328.6 billion but decreased in the Game segment by ¥10.4
billion, or 55.3%, to ¥8.4 billion. Capital expenditures in the
semiconductor businesses within the Electronics segment,
including capital expenditures related to the Cell microprocessor,
amounted to ¥140.0 billion. Capital expenditures in the Pictures
segment increased by ¥4.3 billion, or 73.8%, to ¥10.1 billion. In
All Other, which includes Sony’s consolidated music business,
¥4.2 billion of capital expenditures were recorded, compared to
the ¥9.0 billion of capital expenditures recorded in the previous
fiscal year.
Property, plant and equipment on March 31, 2006 in the
Financial Services segment decreased by ¥1.1 billion, or 2.9%,
to ¥37.4 billion compared with the previous fiscal year-end.
Capital expenditures in the Financial Services segment
increased by ¥0.6 billion, or 15.9%, to ¥4.5 billion.
■OTHER ASSETS
Other assets on March 31, 2006 increased by ¥23.5 billion, or
1.5%, to ¥1,569.4 billion, compared with the previous fiscal
year-end.
Other assets on March 31, 2006 in all segments excluding the
Financial Services segment decreased by ¥129.6 billion to
¥1,059.8 billion.
Deferred tax assets on March 31, 2006 decreased by ¥61.6
billion, or 25.6%, to ¥178.8 billion compared with the previous
fiscal year-end. This was due to the recording of additional
valuation allowances against deferred tax assets by Sony
Corporation and several of Sony’s Japanese domestic and
overseas consolidated subsidiaries, mainly within the Electronics
segment due to continued losses recorded at these businesses.
Other assets in the Financial Services segment on March 31,
2006 increased by ¥70.2 billion, or 14.7%, to ¥548.0 billion
compared with the previous fiscal year-end.
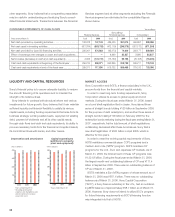
LIABILITIES
Total current and long-term liabilities on March 31, 2006
increased by ¥761.9 billion, or 11.5%, to ¥7,366.8 billion
compared with the previous fiscal year-end. Total current and
long-term liabilities on March 31, 2006 in all segments excluding
the Financial Services segment increased by ¥185.5 billion, or
5.5%, to ¥3,551.9 billion. Total current and long-term liabilities in
the Financial Services segment on March 31, 2006 increased by
¥512.3 billion, or 14.8%, to ¥3,977.6 billion, compared with the
previous fiscal year-end. Total current and long-term liabilities on
March 31, 2006 in all segments excluding the Financial Services
segment would have increased by approximately 2% compared
with the previous fiscal year-end if the value of the yen had
remained the same on March 31, 2006 as it was on
March 31, 2005.
■CURRENT LIABILITIES
Current liabilities on March 31, 2006 increased by ¥390.9 billion,
or 13.9%, to ¥3,200.2 billion compared with the previous fiscal
year-end. Current liabilities on March 31, 2006 in all segments
excluding the Financial Services segment increased by ¥191.8
billion, or 9.0%, to ¥2,329.3 billion.
Short-term borrowings and current portion of long-term debt
on March 31, 2006 in all segments excluding the Financial
Services segment increased ¥21.1 billion, or 10.3%, to ¥225.1
billion compared with the previous fiscal year-end. This was
principally a result of an increase in the current portion of
long-term debt.
Notes and accounts payable, trade on March 31, 2006 in all
segments excluding the Financial Services segment increased
by ¥3.1 billion, or 0.4%, to ¥804.4 billion compared with the
previous fiscal year-end.
Current liabilities on March 31, 2006 in the Financial Services
segment increased by ¥209.7 billion, or 29.6%, to ¥918.3 billion,
mainly due to an increase in short-term borrowing and an
increase in deposits from customers at Sony Bank.
■LONG-TERM LIABILITIES
Long-term liabilities on March 31, 2006 increased by ¥371.0
billion, or 9.8%, to ¥4,166.6 billion compared with the previous
fiscal year-end.
Long-term liabilities on March 31, 2006 in all segments
excluding the Financial Services segment decreased by ¥6.3
billion, or 0.5%, to ¥1,222.6 billion. In addition, Long-term debt on
March 31, 2006 in all segments excluding the Financial Services
segment increased ¥74.0 billion, or 11.8%, to ¥701.4 billion.