Sony 2006 Annual Report Download - page 20
Download and view the complete annual report
Please find page 20 of the 2006 Sony annual report below. You can navigate through the pages in the report by either clicking on the pages listed below, or by using the keyword search tool below to find specific information within the annual report.-
 1
1 -
2
-
3
-
4
-
5
-
6
-
7
-
8
-
9
-
 10
10 -
 11
11 -
 12
12 -
 13
13 -
 14
14 -
 15
15 -
 16
16 -
 17
17 -
 18
18 -
 19
19 -
 20
20 -
 21
21 -
 22
22 -
 23
23 -
 24
24 -
 25
25 -
 26
26 -
 27
27 -
 28
28 -
 29
29 -
 30
30 -
31
-
32
-
33
-
34
-
35
-
36
-
37
-
38
-
39
-
40
-
41
-
42
-
43
-
44
-
45
-
46
-
47
-
48
-
49
-
50
-
51
-
52
-
53
-
54
-
55
-
56
-
57
-
58
-
59
-
60
-
61
-
62
-
63
-
64
-
65
-
66
-
67
-
68
-
69
-
70
-
71
-
72
-
73
-
74
-
75
-
76
-
77
-
78
-
79
-
80
-
81
-
82
-
83
-
84
-
85
-
86
-
87
-
88
-
89
-
90
-
91
-
92
-
93
-
94
-
95
-
96
-
97
-
98
-
99
-
100
-
101
-
102
-
103
-
104
-
105
-
106
-
107
-
108
-
109
-
110
-
111
-
112
-
113
-
114
-
115
-
116
-
117
-
118
-
119
-
120
-
121
-
122
-
123
-
124
-
125
-
126
-
127
-
128
-
129
-
130
-
131
-
132
-
133
-
134
-
135
-
136
-
137
-
138
-
139
-
140
-
141
-
142
-
143
-
144
-
145
-
146
 |
 |
18
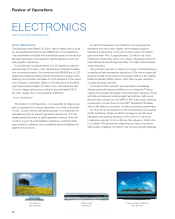
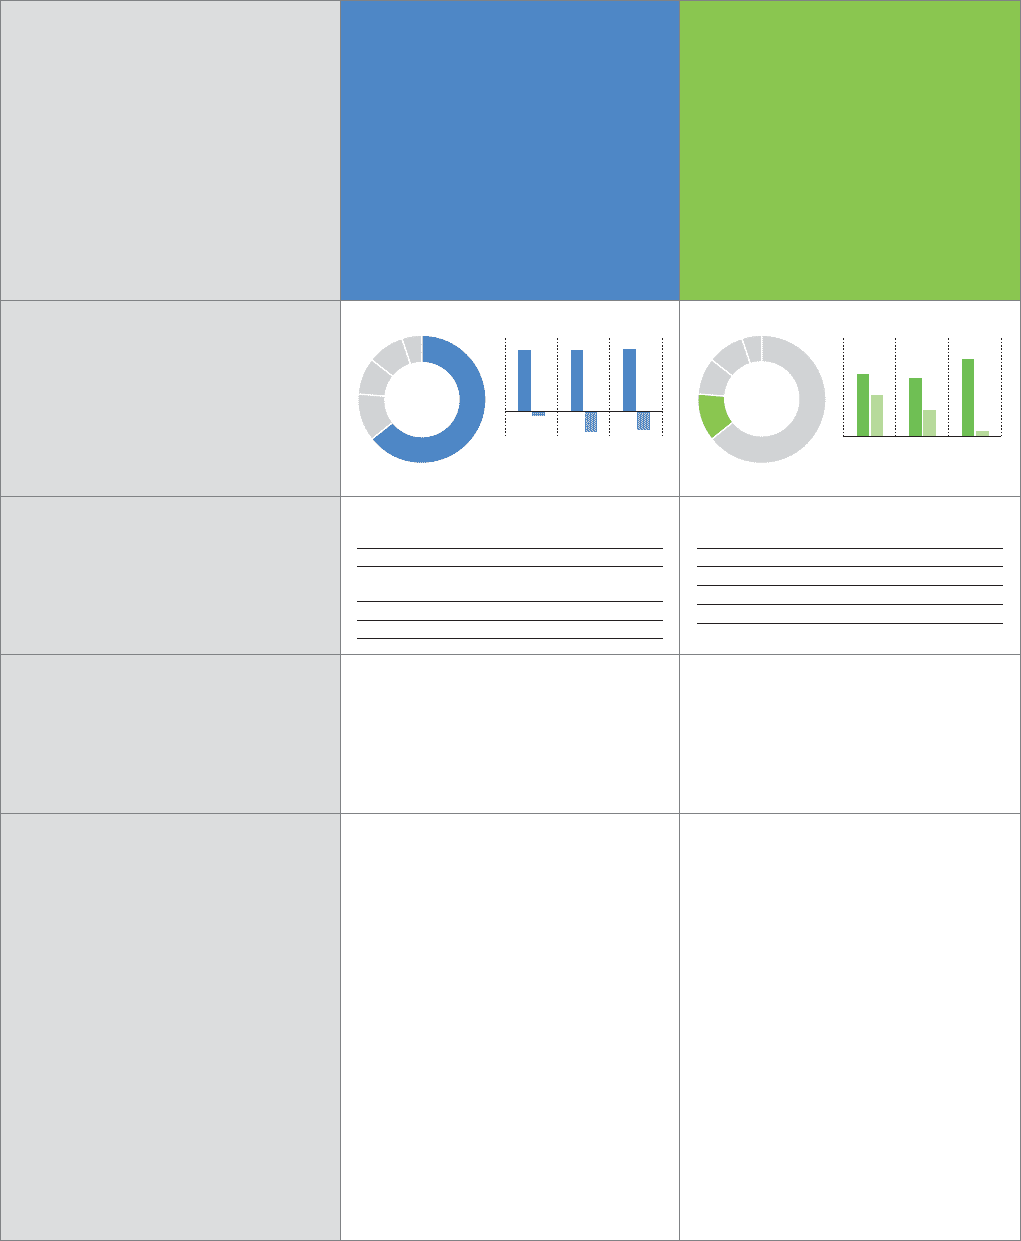
GAMEELECTRONICS
64.3%
2004 2005 2006
■Sales
■Operating income (loss)
12.0%
■Sales
■Operating income
2004 2005 2006
Business Overview
●Sales in this business rose 31.4%. Calculated
using the same exchange rates as the previous
period, sales rose 27%.
●Hardware sales were up sharply, particularly
in Europe and the United States, PSP®
(PlayStation®Portable) was a major contributor to
higher sales, recording brisk sales in all regions,
while sales of PlayStation®2 (PS2) were on a par
with the previous period. Despite a decline in
sales of PS2 software, overall software sales in
Japan, the United States and Europe were
largely in line with the previous period, due to
sales of PSP software.
●Operating income declined 79.7%. Although
profits from the PS2 and PSP businesses
exceeded those in the previous period, this
decrease was mainly the result of continued high
research and development costs associated with
PLAYSTATION®3 (PS3), as well as the recording
of charges associated with preparation for the
launch of the PS3 platform.
The Game business encompasses Sony’s game
console and software businesses, which are
conducted by Sony Computer Entertainment Inc.
2006/2005
(Percent
(Yen in billions, %) 2004 2005 2006 change)
Sales ¥780.2.¥729.8.¥958.6.+31.4.%
Operating income 67.6.43.2.8.7.–79.7.%
Operating margin 8.7.5.9.0.9.
Assets 684.2.482.0.520.4.
●Business sales increased 1.7%. Calculated using
the same exchange rates as the previous period,
however, sales declined 3%.
●Higher sales were recorded for liquid crystal
display (LCD) televisions, including the BRAVIA
line, which registered brisk sales worldwide, and
LCD rear-projection televisions, which saw sales
increase particularly in the United States. In
contrast, sales of cathode ray tube (CRT) and
plasma televisions fell.
●Despite a decrease in sales to outside
customers, an increase in loss on sale, disposal
or impairment of fixed assets and a deterioration
in the cost of sales ratio associated with a
decline in unit selling prices, the business’
operating loss improved as a result of the ¥64.5
billion net gain resulting from the transfer to the
Japanese government of the substitutional
portion of Sony’s Employee Pension Fund, as
well as favorable exchange rates.
●Products that recorded an increase in operating
income included Handycam® video cameras and
VAIO PCs. Operating income declined for such
products as CRT televisions, image sensors and
LCD televisions.
The Electronics business comprises audio, video,
televisions, information and communications
equipment, semiconductors, components and
other products.
2006/2005
(Percent
(Yen in billions, %) 2004 2005 2006 change)
Sales ¥5,087.5.¥5,066.8.¥5,150.5.+1.7.%
Operating income
(loss) (8.1.)(34.3.)(30.9.)—
Operating margin — — —
Assets 3,036.4.3,476.5.3,548.7.
Sales (Financial Services Revenue)
and Operating Income (Loss)
(Pie charts indicate percentage of sales and
operating revenue.)
Fiscal Year in Review
Description of Business
Financial Highlights
by Business
(Years ended March 31)
Business
Note: As of August 1, 2004, Sony and Bertelsmann AG combined their recorded music businesses in a joint venture. In connection with the establishment of this joint venture, the non-Japan-based
disc manufacturing and physical distribution businesses, formerly included within the Music business segment, have been reclassified and are now included in the Electronics business
segment. In addition, effective April 1, 2005, a similar change was made with respect to the Japan-based disc manufacturing businesses. (Continued on following page)
(Yen in billions)(Yen in billions)
5,150.55,087.5
(30.9)(8.1)
5,066.8
(34.3)
958.6
780.2
67.6
729.8
43.2
8.7
Notes: 1. Sales = Sales and operating revenue
2. Operating margin = Operating income/Sales and
operating revenue x 100
3. Includes internal transactions