Sony 2006 Annual Report Download - page 108
Download and view the complete annual report
Please find page 108 of the 2006 Sony annual report below. You can navigate through the pages in the report by either clicking on the pages listed below, or by using the keyword search tool below to find specific information within the annual report.-
 1
1 -
2
-
3
-
4
-
5
-
6
-
7
-
8
-
9
-
10
-
11
-
12
-
13
-
14
-
15
-
16
-
17
-
18
-
19
-
20
-
21
-
22
-
23
-
24
-
25
-
26
-
27
-
28
-
29
-
30
-
31
-
32
-
33
-
34
-
35
-
36
-
37
-
38
-
39
-
40
-
41
-
42
-
43
-
44
-
45
-
46
-
47
-
48
-
49
-
50
-
51
-
52
-
53
-
54
-
55
-
56
-
57
-
58
-
59
-
60
-
61
-
62
-
63
-
64
-
65
-
66
-
67
-
68
-
69
-
70
-
71
-
72
-
73
-
74
-
75
-
76
-
77
-
78
-
79
-
80
-
81
-
82
-
83
-
84
-
85
-
86
-
87
-
88
-
89
-
90
-
91
-
92
-
93
-
94
-
95
-
96
-
97
-
 98
98 -
 99
99 -
 100
100 -
 101
101 -
 102
102 -
 103
103 -
 104
104 -
 105
105 -
 106
106 -
 107
107 -
 108
108 -
 109
109 -
 110
110 -
 111
111 -
 112
112 -
 113
113 -
 114
114 -
 115
115 -
 116
116 -
 117
117 -
 118
118 -
119
-
120
-
121
-
122
-
123
-
124
-
125
-
126
-
127
-
128
-
129
-
130
-
131
-
132
-
133
-
134
-
135
-
136
-
137
-
138
-
139
-
140
-
141
-
142
-
143
-
144
-
145
-
146
 |
 |
106
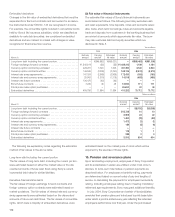
Yen in Dollars in
millions millions
Year ending March 31:
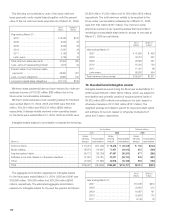
2007 . . . . . . . . . . . . . . . . . . . . . . . . .
¥31,636 $270
2008 . . . . . . . . . . . . . . . . . . . . . . . . .
24,862 212
2009 . . . . . . . . . . . . . . . . . . . . . . . . .
18,857 161
2010 . . . . . . . . . . . . . . . . . . . . . . . . .
15,593 133
2011 . . . . . . . . . . . . . . . . . . . . . . . . .
9,125 78
The aggregate amortization expenses for intangible assets
for the fiscal years ended March 31, 2004, 2005 and 2006 was
¥28,866 million, ¥24,993 million and ¥28,390 million ($243
million), respectively. The estimated aggregate amortization
expense for intangible assets for the next five years is as follows:
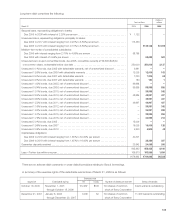
The following is a schedule by year of the future minimum
lease payments under capital leases together with the present
value of the net minimum lease payments as of March 31, 2006:
Yen in Dollars in
millions millions
Year ending March 31:
2007 . . . . . . . . . . . . . . . . . . . . . . . . .
¥18,322 $157
2008 . . . . . . . . . . . . . . . . . . . . . . . . .
9,650 82
2009 . . . . . . . . . . . . . . . . . . . . . . . . .
5,325 46
2010 . . . . . . . . . . . . . . . . . . . . . . . . .
3,081 26
2011 . . . . . . . . . . . . . . . . . . . . . . . . .
2,149 18
Later years . . . . . . . . . . . . . . . . . . . . .
4,725 40
Total minimum lease payments . . . . . . .
43,252 369
Less—Amount representing interest . . .
4,972 42
Present value of net minimum lease
payments . . . . . . . . . . . . . . . . . . . . . .
38,280 327
Less—Current obligations . . . . . . . . . . .
16,966 145
Long-term capital lease obligations . . . .
¥21,314 $182
Minimum lease payments have not been reduced by minimum
sublease income of ¥10,022 million ($86 million) due in the
future under noncancelable subleases.
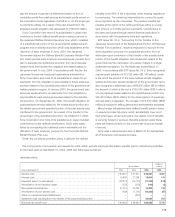
Minimum rental expenses under operating leases for the fiscal
years ended March 31, 2004, 2005 and 2006 were ¥92,649
million, ¥81,391 million and ¥80,014 million ($684 million),
respectively. Sublease rentals received under operating leases
for the fiscal years ended March 31, 2004, 2005 and 2006 were
¥2,923 million, ¥1,933 million and ¥1,350 million ($12 million),
respectively. The total minimum rentals to be received in the
future under noncancelable subleases as of March 31, 2006
were ¥21,843 million ($187 million). The minimum rental
payments required under operating leases that have initial or
remaining noncancelable lease terms in excess of one year at
March 31, 2006 are as follows:
Yen in Dollars in
millions millions
Year ending March 31:
2007 . . . . . . . . . . . . . . . . . . . . . . . . .
¥ 47,500 $ 406
2008 . . . . . . . . . . . . . . . . . . . . . . . . .
34,715 297
2009 . . . . . . . . . . . . . . . . . . . . . . . . .
26,529 227
2010 . . . . . . . . . . . . . . . . . . . . . . . . .
16,320 139
2011 . . . . . . . . . . . . . . . . . . . . . . . . .
11,541 98
Later years . . . . . . . . . . . . . . . . . . . . .
58,932 504
Total minimum future rentals . . . . . . . . .
¥195,537 $1,671
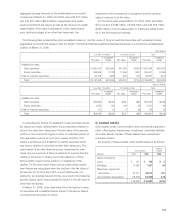
10. Goodwill and intangible assets
Intangible assets acquired during the fiscal year ended March 31,
2006 totaled ¥36,237 million ($310 million), which are subject to
amortization and primarily consist of acquired patent rights of
¥9,922 million ($85 million) and software to be sold, leased or
otherwise marketed of ¥17,653 million ($151 million). The
weighted average amortization period for acquired patent rights
and software to be sold, leased or otherwise marketed is 8
years and 3 years, respectively.
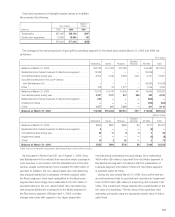
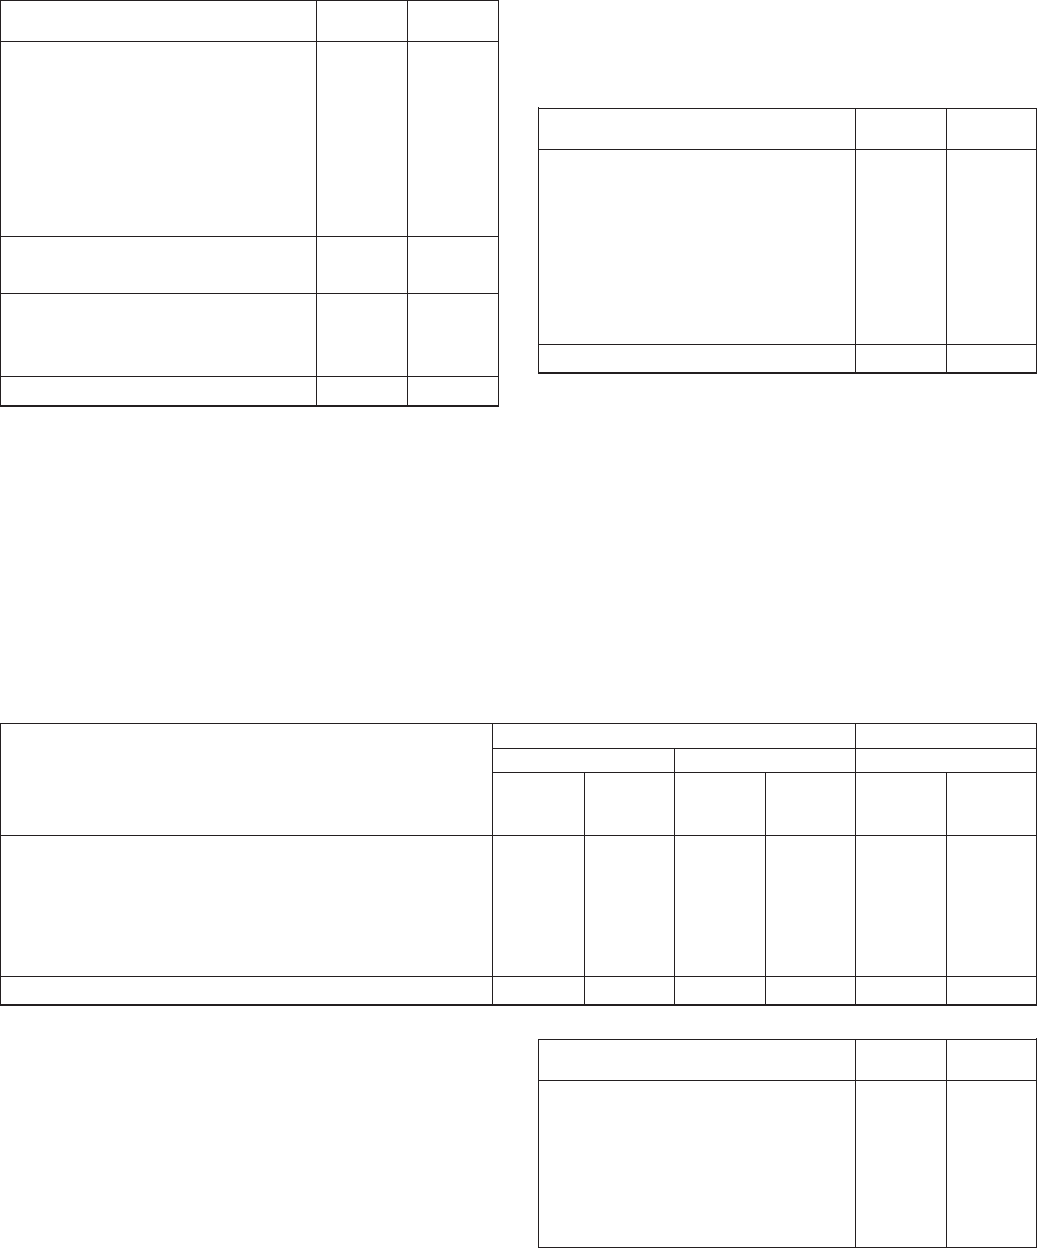
Intangible assets subject to amortization comprise the following:
Yen in millions Dollars in millions
2005 2006 2006
Gross Gross Gross
carrying Accumulated carrying Accumulated carrying Accumulated
March 31 amount amortization amount amortization amount amortization
Artist contracts . . . . . . . . . . . . . . . . . . . . . . . . . . . . . . . . . . . . . .
¥ 15,218 ¥(11,094) ¥ 15,218 ¥ (12,218) $ 130 $(104)
Music catalog . . . . . . . . . . . . . . . . . . . . . . . . . . . . . . . . . . . . . . .
65,674 (19,641) 71,921 (24,012) 615 (205)
Acquired patent rights . . . . . . . . . . . . . . . . . . . . . . . . . . . . . . . . .
55,173 (26,139) 67,467 (30,200) 577 (258)
Software to be sold, leased or otherwise marketed . . . . . . . . . . .
31,907 (16,181) 40,007 (24,194) 342 (207)
Other . . . . . . . . . . . . . . . . . . . . . . . . . . . . . . . . . . . . . . . . . . . . . .
27,648 (11,625) 40,978 (15,133) 350 (130)
Total . . . . . . . . . . . . . . . . . . . . . . . . . . . . . . . . . . . . . . . . . . . . . .
¥195,620 ¥(84,680) ¥235,591 ¥(105,757) $2,014 $(904)