Sony 2006 Annual Report Download - page 51
Download and view the complete annual report
Please find page 51 of the 2006 Sony annual report below. You can navigate through the pages in the report by either clicking on the pages listed below, or by using the keyword search tool below to find specific information within the annual report.-
 1
1 -
2
-
3
-
4
-
5
-
6
-
7
-
8
-
9
-
10
-
11
-
12
-
13
-
14
-
15
-
16
-
17
-
18
-
19
-
20
-
21
-
22
-
23
-
24
-
25
-
26
-
27
-
28
-
29
-
30
-
31
-
32
-
33
-
34
-
35
-
36
-
37
-
38
-
39
-
40
-
 41
41 -
 42
42 -
 43
43 -
 44
44 -
 45
45 -
 46
46 -
 47
47 -
 48
48 -
 49
49 -
 50
50 -
 51
51 -
 52
52 -
 53
53 -
 54
54 -
 55
55 -
 56
56 -
 57
57 -
 58
58 -
 59
59 -
 60
60 -
 61
61 -
62
-
63
-
64
-
65
-
66
-
67
-
68
-
69
-
70
-
71
-
72
-
73
-
74
-
75
-
76
-
77
-
78
-
79
-
80
-
81
-
82
-
83
-
84
-
85
-
86
-
87
-
88
-
89
-
90
-
91
-
92
-
93
-
94
-
95
-
96
-
97
-
98
-
99
-
100
-
101
-
102
-
103
-
104
-
105
-
106
-
107
-
108
-
109
-
110
-
111
-
112
-
113
-
114
-
115
-
116
-
117
-
118
-
119
-
120
-
121
-
122
-
123
-
124
-
125
-
126
-
127
-
128
-
129
-
130
-
131
-
132
-
133
-
134
-
135
-
136
-
137
-
138
-
139
-
140
-
141
-
142
-
143
-
144
-
145
-
146
 |
 |

49
the restructuring charges recorded during the fiscal year ended
March 31, 2006 was an ¥8.5 billion asset impairment write-down
associated with the sale of the Metreon, a U.S. entertainment
complex.
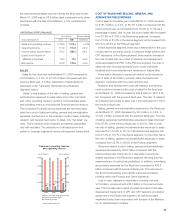
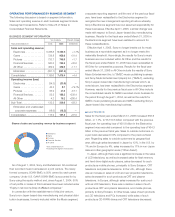
OPERATING PERFORMANCE
Yen in billions Percent change
Years ended March 31 2005 2006 2006/2005
Sales and operating revenue . .
7,159.6 7,475.4 +4.4%
Operating income . . . . . . . . . .
113.9 191.3 +67.9
Income before income taxes . .
157.2 286.3 +82.1
Equity in net income of
affiliated companies . . . . . . . .
29.0 13.2 –54.6
Net income . . . . . . . . . . . . . . .
163.8 123.6 –24.5
SALES
Sales for the fiscal year ended March 31, 2006 increased by
¥315.8 billion, or 4.4%, to ¥7,475.4 billion compared with the
previous fiscal year. A further breakdown of sales figures is
presented under “Operating Performance by Business
Segment” below.
“Sales” in this analysis of the ratio of selling, general and
administrative expenses to sales refers only to the “net sales”
and “other operating revenue” portions of consolidated sales
and operating revenue, and excludes Financial service revenue.
This is because Financial service expenses are recorded sepa-
rately from cost of sales and selling, general and administrative
expenses. Furthermore, in the analysis of cost of sales, including
research and development costs, to sales, only “net sales” are
used. This is because cost of sales is an expense associated
only with net sales. The calculations of all ratios below that
pertain to business segments include intersegment transactions.
COST OF SALES AND SELLING, GENERAL AND
ADMINISTRATIVE EXPENSES
Cost of sales for the fiscal year ended March 31, 2006 increased
by ¥151.3 billion, or 3.0%, to ¥5,151.4 billion compared with the
previous fiscal year, and increased from 76.2% to 77.0% as a
percentage of sales. Year on year, the cost of sales ratio increased
from 81.8% to 81.9% in the Electronics segment, increased
from 73.0% to 80.4% in the Game segment, and increased from
58.7% to 60.2% in the Pictures segment.
In the Electronics segment, there was a deterioration in the cost
of sales ratio for several products, in particular image sensors and
CRT televisions. In the Game segment, there was an increase in
the cost of sales ratio as a result of research and development
costs associated with PS3. In the Pictures segment, the cost of
sales ratio also increased primarily due to lower worldwide
theatrical and home entertainment revenues on feature films.
There was a decrease in personnel-related costs included in
cost of sales of ¥9.8 billion, primarily within the Electronics
segment, compared with the previous fiscal year.
Research and development costs (all research and develop-
ment costs are included within cost of sales) for the fiscal year
ended March 31, 2006 increased by ¥29.8 billion to ¥531.8 bil-
lion compared with the previous fiscal year. The ratio of research
and development costs to sales was 7.9% compared to 7.6% in
the previous fiscal year.
Selling, general and administrative expenses for the fiscal year
ended March 31, 2006 decreased by ¥8.0 billion, or 0.5%, to
¥1,527.0 billion compared with the previous fiscal year. The ratio
of selling, general and administrative expenses to sales improved
from 23.2% in the previous fiscal year to 22.6%. Year on year,
the ratio of selling, general and administrative expenses to sales
improved from 19.0% to 18.1% in the Electronics segment and
from 21.0% to 18.7% in the Game segment. On the other hand,
the ratio of selling, general and administrative expenses to sales
increased from 32.5% to 36.0% in the Pictures segment.
Personnel-related costs in selling, general and administrative
expenses decreased by ¥60.4 billion compared with the
previous fiscal year mainly due to a decrease in severance-
related expenses in the Electronics segment resulting from the
implementation of restructuring initiatives. In addition, advertising
and publicity expenses for the fiscal year increased by ¥59.8
billion compared with the previous fiscal year. This was due to
the fact that advertising and publicity expenses increased,
primarily within the Pictures and Game segments.
Loss on sale, disposal or impairment of assets, net was
¥73.9 billion, compared with ¥28.0 billion in the previous fiscal
year. This increase was a result of losses recorded on the sale,
disposal and impairment of CRT and CRT television production
equipment in the Electronics segment, as well as an asset
impairment write-down associated with the sale of the Metreon,
a U.S. entertainment complex.
Sales and operating revenue
and operating income
■ Sales and operating revenue (left)
■ Operating income (right)
● Operating margin
*Years ended March 31
(Yen in billions) (Yen in billions)
8,000
6,000
4,000
2,000
0
800
600
400
200
0
2004 2005 2006
1.3%
1.6%
2.6%