Sony 2006 Annual Report Download - page 105
Download and view the complete annual report
Please find page 105 of the 2006 Sony annual report below. You can navigate through the pages in the report by either clicking on the pages listed below, or by using the keyword search tool below to find specific information within the annual report.-
 1
1 -
2
-
3
-
4
-
5
-
6
-
7
-
8
-
9
-
10
-
11
-
12
-
13
-
14
-
15
-
16
-
17
-
18
-
19
-
20
-
21
-
22
-
23
-
24
-
25
-
26
-
27
-
28
-
29
-
30
-
31
-
32
-
33
-
34
-
35
-
36
-
37
-
38
-
39
-
40
-
41
-
42
-
43
-
44
-
45
-
46
-
47
-
48
-
49
-
50
-
51
-
52
-
53
-
54
-
55
-
56
-
57
-
58
-
59
-
60
-
61
-
62
-
63
-
64
-
65
-
66
-
67
-
68
-
69
-
70
-
71
-
72
-
73
-
74
-
75
-
76
-
77
-
78
-
79
-
80
-
81
-
82
-
83
-
84
-
85
-
86
-
87
-
88
-
89
-
90
-
91
-
92
-
93
-
94
-
 95
95 -
 96
96 -
 97
97 -
 98
98 -
 99
99 -
 100
100 -
 101
101 -
 102
102 -
 103
103 -
 104
104 -
 105
105 -
 106
106 -
 107
107 -
 108
108 -
 109
109 -
 110
110 -
 111
111 -
 112
112 -
 113
113 -
 114
114 -
 115
115 -
116
-
117
-
118
-
119
-
120
-
121
-
122
-
123
-
124
-
125
-
126
-
127
-
128
-
129
-
130
-
131
-
132
-
133
-
134
-
135
-
136
-
137
-
138
-
139
-
140
-
141
-
142
-
143
-
144
-
145
-
146
 |
 |
103
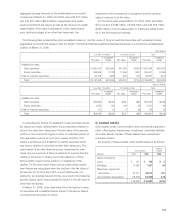
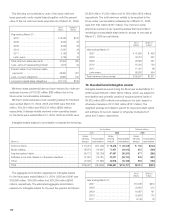
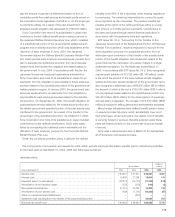
Account balances and transactions with affiliated companies
accounted for under the equity method are presented below:
Dollars in
Yen in millions millions
March 31 2005 2006 2006
Accounts receivable, trade. .
¥50,062 ¥44,837 $383
Advances . . . . . . . . . . . . . .
¥16,756 ¥15,985 $137
Accounts payable, trade . . .
¥15,225 ¥40,507 $346
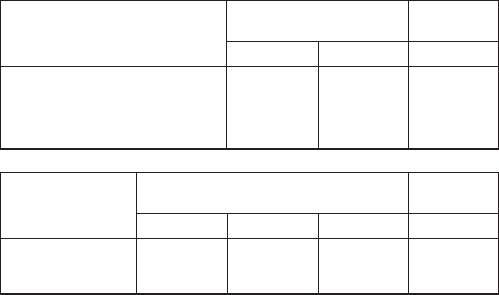
Dollars in
Yen in millions millions
Years ended March 31 2004 2005 2006 2006
Sales . . . . . . . .
¥258,454 ¥256,799 ¥234,636 $2,005
Purchases . . . .
¥106,100 ¥101,976 ¥282,071 $2,411
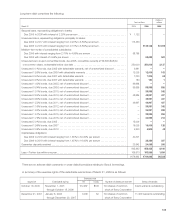
As of April 1, 2004, Sony Corporation made Sony Computer
Entertainment Inc. (“SCE”) a wholly-owned subsidiary through
a stock for stock exchange pursuant to the provision of Article
358 of the Japanese Commercial Code which does not require
the approval of the General Meeting of Shareholders. The stock
for stock exchange ratio was determined based on the estimated
equity values of SCE and Sony on a consolidated basis. Through
the stock for stock exchange, Sony Corporation provided
1,000,000 shares of its common stock to the then Executive
Deputy President, Corporate Executive Officer of Sony
Corporation who had owned 100 shares of SCE’s common
stock. This transaction did not have a material impact on Sony’s
results of operations and financial position for the fiscal year
ended March 31, 2005.
Dividends from affiliated companies accounted for under the
equity method for the fiscal years ended March 31, 2004, 2005
and 2006 were ¥3,446 million, ¥13,391 million and ¥22,970
million ($197 million), respectively.
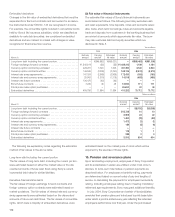
7. Accounts receivable securitization programs
In Japan, Sony set up several accounts receivable sales
programs whereby Sony can sell up to ¥47,500 million ($406
million) of eligible trade accounts receivable. Through these
programs, Sony can sell receivables to special purpose entities
owned and operated by banks. Sony can sell receivables in
which the agreed upon original due dates are no more than
190 days after the sales of receivables. These transactions
are accounted for as sales in accordance with FAS No. 140,
“Accounting for Transfers and Servicing of Financial Assets and
Extinguishments of Liabilities”, because Sony has relinquished
control of the receivables. The initial sale of these receivables
MGM continues to operate under the Metro–Goldwyn–Mayer
name as a private company, headquartered in Los Angeles,
focused on new film production and distribution activities. As
part of the acquisition, SCA invested $257 million for 20% of the
total equity capital, which includes both common stock and a
significant amount of non-voting preferred stock with detachable
common stock warrants. Though Sony owns 20% of MGM
Holdings’ total equity on a fully diluted basis as a result of the
warrants dilution, Sony owns 45% of the total outstanding
common stock and therefore, records 45% of MGM Holdings’
net income (loss) as equity in net income of affiliated companies.
In September 2005, Sony sold 230,000 shares of Monex
Beans Holdings, Inc. As a result of this sale, Sony’s ownership
interest has been reduced from 20.1% to 10.3%. Therefore,
Monex Beans Holdings, Inc. is no longer accounted for under
the equity method. The financial position and operating results of
Monex Beans Holdings, Inc. as of and for the fiscal year ended
March 31, 2006 are not included in the above summarized
combined financial information. See Note 20 for more information
on this transaction.
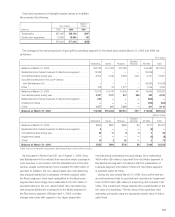
The proportionate share in the underlying net assets of the
investee exceeded the carrying value of investments in affiliated
companies by ¥42,731 million and ¥36,875 million ($315 million)
at March 31, 2005 and 2006, respectively. These differences
primarily relate to the differences in the carrying value of the net
assets contributed by Sony and Bertelsmann AG upon the
formation of SONY BMG in August 2004. The contribution
of assets to SONY BMG was accounted for at book value.
Acquisitions by Bertelsmann AG’s recorded music business
shortly prior to the formation of SONY BMG resulted in goodwill
comprising a significant portion of the assets contributed to
SONY BMG by Bertelsmann AG, whereas Sony’s contributed
assets had a lower historical basis. As a result, Sony’s carrying
value of the investment in SONY BMG is below its 50% share
of the underlying assets of SONY BMG. As the contributions
for both Sony and Bertelsmann AG were recorded at historical
book value by SONY BMG, there is a basis difference attributable
to a non-depreciable asset which is not being amortized. Differ-
ences in the carrying value of Sony’s other equity investments
and the proportionate share of the fair value of underlying net
assets primarily relates to unamortizable goodwill.
Affiliated companies accounted for under the equity method
with an aggregate carrying amount of ¥17,676 million and
¥4,588 million ($39 million) at March 31, 2005 and 2006,
were quoted on established markets at an aggregate value of
¥95,246 million and ¥34,462 million ($295 million), respectively.