Sony 2006 Annual Report Download - page 69
Download and view the complete annual report
Please find page 69 of the 2006 Sony annual report below. You can navigate through the pages in the report by either clicking on the pages listed below, or by using the keyword search tool below to find specific information within the annual report.-
 1
1 -
2
-
3
-
4
-
5
-
6
-
7
-
8
-
9
-
10
-
11
-
12
-
13
-
14
-
15
-
16
-
17
-
18
-
19
-
20
-
21
-
22
-
23
-
24
-
25
-
26
-
27
-
28
-
29
-
30
-
31
-
32
-
33
-
34
-
35
-
36
-
37
-
38
-
39
-
40
-
41
-
42
-
43
-
44
-
45
-
46
-
47
-
48
-
49
-
50
-
51
-
52
-
53
-
54
-
55
-
56
-
57
-
58
-
 59
59 -
 60
60 -
 61
61 -
 62
62 -
 63
63 -
 64
64 -
 65
65 -
 66
66 -
 67
67 -
 68
68 -
 69
69 -
 70
70 -
 71
71 -
 72
72 -
 73
73 -
 74
74 -
 75
75 -
 76
76 -
 77
77 -
 78
78 -
 79
79 -
80
-
81
-
82
-
83
-
84
-
85
-
86
-
87
-
88
-
89
-
90
-
91
-
92
-
93
-
94
-
95
-
96
-
97
-
98
-
99
-
100
-
101
-
102
-
103
-
104
-
105
-
106
-
107
-
108
-
109
-
110
-
111
-
112
-
113
-
114
-
115
-
116
-
117
-
118
-
119
-
120
-
121
-
122
-
123
-
124
-
125
-
126
-
127
-
128
-
129
-
130
-
131
-
132
-
133
-
134
-
135
-
136
-
137
-
138
-
139
-
140
-
141
-
142
-
143
-
144
-
145
-
146
 |
 |

67
portion of the employee pension fund, an increase in deferred
acquisition costs within the Financial Services segment and
effect of the gain on change in interest in subsidiaries and
equity investees.
Compared with the previous fiscal year, net cash provided by
operating activities decreased mainly as a result of taking into
account the lower net income recorded during the fiscal year as
compared to the previous fiscal year, and, as noted above, the
increase in inventory during the fiscal year compared with the
previous fiscal year, the effect of the gain on the transfer to the
Japanese Government of the substitutional portion of the
employee pension fund, and of the gain on change in interest in
subsidiaries and equity investees.
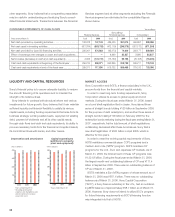
Investing Activities: During the fiscal year, Sony used ¥871.3
billion of net cash in investing activities, an decrease of ¥59.9
billion, or 6.4%, compared with the previous fiscal year. Of this
total, all segments excluding the Financial Services segment
used ¥296.4 billion of net cash in investing activities, an
decrease of ¥175.7 billion, or 37.2%, compared with the
previous fiscal year, and the Financial Services segment used
¥563.8 billion in net cash, an increase of ¥142.4 billion, or
33.8%. During the fiscal year, purchases of fixed assets (capital
expenditures) were made, primarily due to proactive capital
expenditures in semiconductors mainly within the Electronics
segment, mostly associated with image sensors.
Within the Financial Services segment, payments for
investments and advances exceeded proceeds from maturities
of marketable securities, sales of securities investments and
collections of advances primarily as a result of investments in
mainly Japanese fixed income securities resulting from an
increase in insurance premiums at Sony Life, and an increase
in the outstanding balance of mortgage loans at Sony Bank.
Compared with the previous fiscal year, net cash used in
investing activities decreased, due primarily to the fact that in the
previous fiscal year, investments were carried out principally in
relation to S-LCD and in semiconductor fabrication equipment,
particularly investments associated with the advanced
microprocessor Cell. On the other hand, within the Financial
Services segment, net cash used in investing activities increased
due to an increase in investments and advances compared to
the previous fiscal year.
In all segments excluding the Financial Services segment, the
difference between cash generated from operating activities and
cash used in investing activities was a use of cash of ¥44.4
billion, as compared to the ¥13.3 billion of cash generated in the
previous fiscal year.
Financing Activities: During the fiscal year ended March 31,
2006, ¥359.9 billion of net cash was provided by financing
activities. Of the total, ¥74.6 billion of net cash was generated
from financing activities in all segments excluding the Financial
Services segment compared to a use of net cash in the previous
fiscal year of ¥95.4 billion. This was a result of straight bonds
issued in order to redeem bonds maturing during the fiscal years
ended March 31, 2006 and March 31, 2007.
In the Financial Services segment, as a result of an increase in
policyholder accounts at Sony Life, and an increase in deposits
from customers, as well as call loan borrowings carried out at
Sony Bank, ¥274.9 billion of net cash was generated by
financing activities.
Accounting for all these factors and the effect of exchange
rate changes, the total outstanding balance of cash and cash
equivalents at the end of the fiscal year decreased by ¥76.0
billion, or 9.8%, to ¥703.1 billion, compared with the end of the
previous fiscal year. The total outstanding balance of cash and
cash equivalents of all segments excluding the Financial
Services segment increased by ¥65.7 billion, or 12.6%, to
¥585.5 billion, and for the Financial Services segment,
decreased by ¥141.7 billion, or 54.6%, to ¥117.6 billion,
compared with the end of the previous fiscal year.
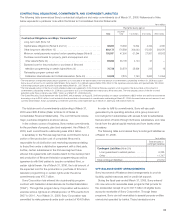
CONDENSED STATEMENTS OF CASH FLOWS
SEPARATING OUT THE FINANCIAL SERVICES SEGMENT
(UNAUDITED)
The following schedule shows unaudited condensed statements
of cash flow for the Financial Services segment and all other
segments excluding the Financial Services segment as well as
condensed consolidated statements of cash flow. These
presentations are not required under U.S. GAAP, which is used
in Sony’s consolidated financial statements. However, because
the Financial Services segment is different in nature from Sony’s
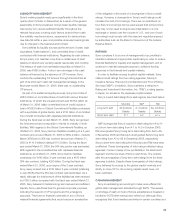
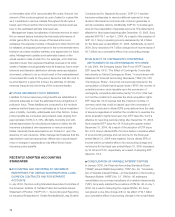
(Yen in billions)
Cash flows
■ Cash flows from operating activities
■ Cash flows from investing activities
■ Cash flows from financing activities
*Years ended March 31
1,000
500
0
–500
–1,000 2004 2005 2006