Sony 2006 Annual Report Download - page 52
Download and view the complete annual report
Please find page 52 of the 2006 Sony annual report below. You can navigate through the pages in the report by either clicking on the pages listed below, or by using the keyword search tool below to find specific information within the annual report.-
 1
1 -
2
-
3
-
4
-
5
-
6
-
7
-
8
-
9
-
10
-
11
-
12
-
13
-
14
-
15
-
16
-
17
-
18
-
19
-
20
-
21
-
22
-
23
-
24
-
25
-
26
-
27
-
28
-
29
-
30
-
31
-
32
-
33
-
34
-
35
-
36
-
37
-
38
-
39
-
40
-
41
-
 42
42 -
 43
43 -
 44
44 -
 45
45 -
 46
46 -
 47
47 -
 48
48 -
 49
49 -
 50
50 -
 51
51 -
 52
52 -
 53
53 -
 54
54 -
 55
55 -
 56
56 -
 57
57 -
 58
58 -
 59
59 -
 60
60 -
 61
61 -
 62
62 -
63
-
64
-
65
-
66
-
67
-
68
-
69
-
70
-
71
-
72
-
73
-
74
-
75
-
76
-
77
-
78
-
79
-
80
-
81
-
82
-
83
-
84
-
85
-
86
-
87
-
88
-
89
-
90
-
91
-
92
-
93
-
94
-
95
-
96
-
97
-
98
-
99
-
100
-
101
-
102
-
103
-
104
-
105
-
106
-
107
-
108
-
109
-
110
-
111
-
112
-
113
-
114
-
115
-
116
-
117
-
118
-
119
-
120
-
121
-
122
-
123
-
124
-
125
-
126
-
127
-
128
-
129
-
130
-
131
-
132
-
133
-
134
-
135
-
136
-
137
-
138
-
139
-
140
-
141
-
142
-
143
-
144
-
145
-
146
 |
 |

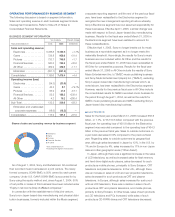
50
OPERATING INCOME
Operating income for the fiscal year ended March 31, 2006
increased by ¥77.3 billion, or 67.9%, to ¥191.3 billion compared
with the previous fiscal year. The operating income margin
increased from 1.6% to 2.6%. In descending order by amount
of financial impact, the Financial Services segment, the Pictures
segment, All Other and the Game segment contributed to oper-
ating income. On the other hand, although there was a net gain
from the transfer to the Japanese Government of the substitutional
portion of Sony’s Employee Pension Fund and the depreciation
of the yen, the Electronics segment recorded an operating loss
mainly due to a decrease in sales to outside customers, an
increase in loss on sale, disposal or impairment of assets and a
deterioration in the cost of sales ratio associated with a decline
in unit selling prices. For a further breakdown of operating income
for each segment, please refer to “Operating Performance by
Business Segment” below.
OTHER INCOME AND EXPENSES
In the consolidated results for the fiscal year ended March 31,
2006, other income increased by ¥56.0 billion, or 57.4%, to
¥153.6 billion, while other expenses increased by ¥4.2 billion, or
7.7%, to ¥58.5 billion, compared with the previous fiscal year.
The net amount of other income and other expenses was net
other income of ¥95.1 billion, an increase of ¥51.8 billion,
compared with the previous fiscal year.
The gain on change in interest in subsidiaries and equity
investees increased by ¥44.5 billion, or 272.7% compared to
the previous fiscal year to ¥60.8 billion. This was mainly the
result of a gain of ¥21.5 billion on the change in interest in subsid-
iaries and equity investees resulting from the initial public offering
of Sony Communication Network Corporation (“SCN”), a gain of
¥20.6 billion on the change in interest resulting from the partial
sale of Sony’s investment in Monex Beans Holdings, Inc., and
gains of ¥12.0 billion and ¥6.6 billion respectively on the change
of interest at So-net M3 Inc., a consolidated subsidiary of SCN
and at DeNA Co., Ltd., an equity affiliate of SCN accounted for
by the equity method.
Interest and dividends of ¥24.9 billion was recorded in the
fiscal year ended March 31, 2006 an increase of ¥10.2 billion,
or 69.5%, compared with the previous year. This increase was
mainly the result of an increase in interest received resulting from
an improvement in the rate of return on overseas investments.
For the fiscal year ended March 31, 2006, interest payments
totaling ¥29.0 billion were recorded, an increase of ¥4.4 billion,
or 18.0%, compared with the previous year.
In addition, a net foreign exchange loss of ¥3.1 billion was
recorded in the fiscal year ended March 31, 2006, compared to
a net foreign exchange loss of ¥0.5 billion recorded in the previ-
ous fiscal year. The net foreign exchange loss was recorded
because the value of the yen, especially during the first and third
quarters of the fiscal year ended March 31, 2006, was lower
than the value of the yen at the time that Sony entered into
foreign exchange forward contracts and foreign currency option
contracts. These contracts are entered into by Sony to mitigate
the foreign exchange rate risk to cash flows that arises from
settlements of foreign currency denominated accounts receiv-
able and accounts payable, as well as foreign currency denomi-
nated transactions between consolidated subsidiaries.
INCOME BEFORE INCOME TAXES
Income before income taxes for the fiscal year ended March 31,
2006 increased ¥129.1 billion, or 82.1%, to ¥286.3 billion com-
pared with the previous fiscal year, as a result of the increase in
operating income and the increase in the net amount of other
income and other expenses mentioned above.
INCOME TAXES
Income taxes for the fiscal year ended March 31, 2006 increased
by ¥160.5 billion to ¥176.5 billion. Compared to an effective tax
rate of 10.2% in the previous fiscal year, the effective tax rate
was 61.6% in the current fiscal year. This effective tax rate
exceeded the Japanese statutory tax rate primarily due to the
recording of additional valuation allowances against deferred tax
assets by Sony Corporation and several of Sony’s Japanese
domestic and overseas consolidated subsidiaries, mainly within
the Electronics segment, due to continued losses recorded at
these businesses and the recording of an additional tax provision
for the undistributed earnings of certain foreign subsidiaries.
The effective tax rate was significantly lower than the Japanese
statutory rate in the previous fiscal year as a result of the reversal
of valuation allowances at Sony’s U.S. subsidiaries associated
with an improvement in operating performance.
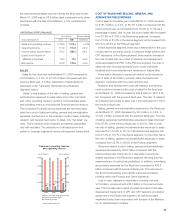
8
6
4
2
0
600
450
300
150
02004 2005 2006
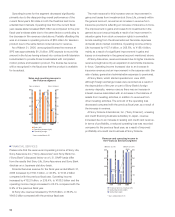
7.5% 7.6% 7.9%
Research and development
expenses and as a percentage
of sales
■Research and development
expenses
●Percentage of sales
*Years ended March 31
*Excluding the Financial
Services segment
(Yen in billions) (%)
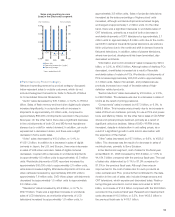
Cost of sales and selling, general
and administrative (SGA) expenses
as a percentage of sales
● Cost of sales/sales
● SGA/sales
*Years ended March 31
*Excluding the Financial
Services segment
(%)
80
60
40
20
02004 2005 2006
73.5%
25.9%
76.2%
23.2%
77.0%
22.6%