Sony 2006 Annual Report Download - page 54
Download and view the complete annual report
Please find page 54 of the 2006 Sony annual report below. You can navigate through the pages in the report by either clicking on the pages listed below, or by using the keyword search tool below to find specific information within the annual report.-
 1
1 -
2
-
3
-
4
-
5
-
6
-
7
-
8
-
9
-
10
-
11
-
12
-
13
-
14
-
15
-
16
-
17
-
18
-
19
-
20
-
21
-
22
-
23
-
24
-
25
-
26
-
27
-
28
-
29
-
30
-
31
-
32
-
33
-
34
-
35
-
36
-
37
-
38
-
39
-
40
-
41
-
42
-
43
-
 44
44 -
 45
45 -
 46
46 -
 47
47 -
 48
48 -
 49
49 -
 50
50 -
 51
51 -
 52
52 -
 53
53 -
 54
54 -
 55
55 -
 56
56 -
 57
57 -
 58
58 -
 59
59 -
 60
60 -
 61
61 -
 62
62 -
 63
63 -
 64
64 -
65
-
66
-
67
-
68
-
69
-
70
-
71
-
72
-
73
-
74
-
75
-
76
-
77
-
78
-
79
-
80
-
81
-
82
-
83
-
84
-
85
-
86
-
87
-
88
-
89
-
90
-
91
-
92
-
93
-
94
-
95
-
96
-
97
-
98
-
99
-
100
-
101
-
102
-
103
-
104
-
105
-
106
-
107
-
108
-
109
-
110
-
111
-
112
-
113
-
114
-
115
-
116
-
117
-
118
-
119
-
120
-
121
-
122
-
123
-
124
-
125
-
126
-
127
-
128
-
129
-
130
-
131
-
132
-
133
-
134
-
135
-
136
-
137
-
138
-
139
-
140
-
141
-
142
-
143
-
144
-
145
-
146
 |
 |

52
a separate reporting segment until the end of the previous fiscal
year, have been reclassified to the Electronics segment to
recognize the new management reporting structure whereby
Sony’s Electronics segment has now assumed responsibility for
these businesses. Effective April 1, 2005, a similar change was
made with respect to Sony’s Japan-based disc manufacturing
business. Results for the fiscal year ended March 31, 2005 in
the Electronics segment have been restated to account for
these reclassifications.
Effective April 1, 2005, Sony no longer breaks out its music
business as a reportable segment as it no longer meets the
materiality threshold. Accordingly, the results for Sony’s music
business are now included within All Other and the results for
the fiscal year ended March 31, 2005 have been reclassified to
All Other for comparative purposes. Results for the fiscal year
ended March 31, 2006 in All Other include the results of Sony
Music Entertainment Inc.’s (“SMEI”) music publishing business
and Sony Music Entertainment (Japan) Inc. (“SMEJ”), excluding
Sony’s Japan-based disc manufacturing business which, as
noted above, has been reclassified to the Electronics segment.
However, results for the previous fiscal year in All Other include
the consolidated results for SMEI’s recorded music business for
the period through August 1, 2004, as well as the results for
SMEI’s music publishing business and SMEJ excluding Sony’s
Japan-based disc manufacturing business.
■ELECTRONICS
Sales for the fiscal year ended March 31, 2006 increased ¥83.6
billion, or 1.7%, to ¥5,150.5 billion compared with the previous
fiscal year. An operating loss of ¥30.9 billion in the Electronics
segment was recorded compared to the operating loss of ¥34.3
billion in the previous fiscal year. Sales to outside customers on
a yen basis decreased 0.9% compared to the previous fiscal
year. Regarding sales to outside customers by geographical
area, although sales decreased in Japan by 12%, in the U.S. by
1% and in Europe by 4%, sales increased by 11% in non-Japan
Asia and other geographic areas (“Other Areas”).
In Japan, although there was a significant increase in the sales
of LCD televisions, as well as increased sales for flash memory
and hard drive digital audio players, sales decreased for such
products as mobile phones, principally to Sony Ericsson, CRT
televisions and plasma televisions. In the U.S., although there
was an increase in sales of LCD and rear projection televisions,
sales decreased for such products as CRT and plasma
televisions. In Europe, although sales increased for such prod-
ucts as LCD televisions, there was a decline in sales of such
products as CRT and plasma televisions, and mobile phones,
primarily to Sony Ericsson. In Other Areas, sales of such products
as LCD televisions and PCs increased, while sales of such
products as CD-R/RW drives and CRT televisions decreased.
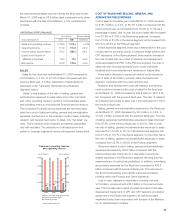
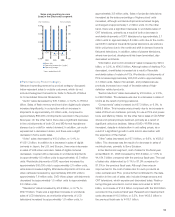
OPERATING PERFORMANCE BY BUSINESS SEGMENT
The following discussion is based on segment information.
Sales and operating revenue in each business segment include
intersegment transactions. Refer to Note 25 of Notes to
Consolidated Financial Statements.
BUSINESS SEGMENT INFORMATION
Yen in billions Percent change
Years ended March 31 2005 2006 2006/2005
Sales and operating revenue
Electronics . . . . . . . . . . . .
5,066.8 5,150.5 +1.7%
Game . . . . . . . . . . . . . . . .
729.8 958.6 +31.4%
Pictures . . . . . . . . . . . . . .
733.7 745.9 +1.7%
Financial Services . . . . . . .
560.6 743.2 +32.6%
All Other . . . . . . . . . . . . . .
459.9 408.9 –11.1%
Elimination . . . . . . . . . . . .
(391.1) (531.6) —%
Consolidated . . . . . . . . . . . .
7,159.6 7,475.4 +4.4%
Operating income (loss)
Electronics . . . . . . . . . . . .
(34.3) (30.9) —%
Game . . . . . . . . . . . . . . . .
43.2 8.7 –79.7%
Pictures . . . . . . . . . . . . . .
63.9 27.4 –57.1%
Financial Services . . . . . . .
55.5 188.3 +239.4%
All Other . . . . . . . . . . . . . .
4.2 16.2 +286.4%
Sub-Total . . . . . . . . . . . . . . .
132.5 209.8 +58.3%
Elimination and unallocated
corporate expenses . . . .
(18.6) (18.5) —%
Consolidated . . . . . . . . . . . .
113.9 191.3 +67.9%
As of August 1, 2004, Sony and Bertelsmann AG combined
their recorded music businesses in a joint venture. The newly
formed company, SONY BMG, is 50% owned by each parent
company. Under U.S. GAAP, SONY BMG is accounted for by
Sony using the equity method and, since August 1, 2004, 50%
of net profits or losses of this business have been included under
“Equity in net income (loss) of affiliated companies.”
In connection with the establishment of this joint venture,
Sony’s non-Japan-based disc manufacturing and physical distri-
bution businesses, formerly included within the Music segment,
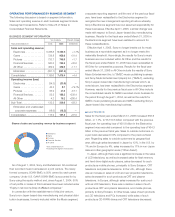
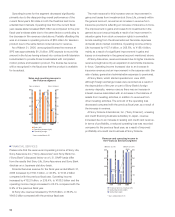
■ Electronics
■ Game
■ Pictures
■ Financial Services
■ All Other
*Years ended March 31
*Including intersegment transactions
Shares of sales and operating revenue by business segment
12.0% 64.3%
9.3%
9.3%
5.1%