Sony 2006 Annual Report Download - page 55
Download and view the complete annual report
Please find page 55 of the 2006 Sony annual report below. You can navigate through the pages in the report by either clicking on the pages listed below, or by using the keyword search tool below to find specific information within the annual report.-
 1
1 -
2
-
3
-
4
-
5
-
6
-
7
-
8
-
9
-
10
-
11
-
12
-
13
-
14
-
15
-
16
-
17
-
18
-
19
-
20
-
21
-
22
-
23
-
24
-
25
-
26
-
27
-
28
-
29
-
30
-
31
-
32
-
33
-
34
-
35
-
36
-
37
-
38
-
39
-
40
-
41
-
42
-
43
-
44
-
 45
45 -
 46
46 -
 47
47 -
 48
48 -
 49
49 -
 50
50 -
 51
51 -
 52
52 -
 53
53 -
 54
54 -
 55
55 -
 56
56 -
 57
57 -
 58
58 -
 59
59 -
 60
60 -
 61
61 -
 62
62 -
 63
63 -
 64
64 -
 65
65 -
66
-
67
-
68
-
69
-
70
-
71
-
72
-
73
-
74
-
75
-
76
-
77
-
78
-
79
-
80
-
81
-
82
-
83
-
84
-
85
-
86
-
87
-
88
-
89
-
90
-
91
-
92
-
93
-
94
-
95
-
96
-
97
-
98
-
99
-
100
-
101
-
102
-
103
-
104
-
105
-
106
-
107
-
108
-
109
-
110
-
111
-
112
-
113
-
114
-
115
-
116
-
117
-
118
-
119
-
120
-
121
-
122
-
123
-
124
-
125
-
126
-
127
-
128
-
129
-
130
-
131
-
132
-
133
-
134
-
135
-
136
-
137
-
138
-
139
-
140
-
141
-
142
-
143
-
144
-
145
-
146
 |
 |
53
● Performance by Product Category
Sales and operating revenue by product category discussed
below represent sales to outside customers, which do not
include intersegment transactions. Refer to Note 25 of Notes
to Consolidated Financial Statements.
“Audio” sales decreased by ¥35.7 billion, or 6.2%, to ¥536.2
billion. Sales of flash memory and hard drive digital audio players
increased significantly, in conjunction with an increase in
shipments to approximately 4.5 million units, compared to
approximately 850,000 unit shipments recorded in the previous
fiscal year. On the other hand, there was a significant decrease
in the unit shipments of both CD and MD format headphone
stereos due to a shift in market demand. In addition, car audio
experienced a decrease in sales, and there was a slight
decrease in home audio sales.
“Video” sales decreased by ¥15.0 billion, or 1.4%, to
¥1,021.3 billion. In addition to a decrease in sales of digital
cameras in Japan, the U.S. and Europe, there was a decrease
in sales of VHS video recorders. Sales of digital cameras
decreased, coupled with a decrease in worldwide shipments
by approximately 0.5 million units to approximately 13.5 million
units. Worldwide shipments of DVD recorders increased by
approximately 300,000 units to approximately 2.0 million units,
while sales increased slightly. Worldwide shipments of home-use
video cameras increased by approximately 250,000 units to
approximately 7.6 million units. DVD-Video player unit shipments
decreased by approximately 1.5 million units to approximately
8.0 million units.
“Televisions” sales increased by ¥6.6 billion, or 0.7%, to
¥927.8 billion. There was a significant increase in worldwide
sales of LCD televisions, as worldwide shipments of LCD
televisions increased by approximately 1.8 million units, to
approximately 2.8 million units. Sales of projection televisions
increased as the sales percentage of higher priced units
increased, although worldwide shipments remained largely
unchanged at approximately 1.2 million units. On the other
hand, there was a significant decrease in worldwide sales of
CRT televisions, primarily as a result of both a decrease in
worldwide shipments of CRT televisions by approximately 2.7
million units to approximately 6.8 million units due to the contin-
ued shift in demand towards flat panel televisions, as well as a
fall in unit prices due to the continued shift in demand towards
flat panel televisions. In addition, sales of plasma televisions,
where new product development has been terminated, also
decreased worldwide.
“Information and Communications” sales increased by ¥26.4
billion, or 3.2%, to ¥842.5 billion. Although sales of desktop PCs
decreased, overall sales increased as a result of favorable
worldwide sales of notebook PCs. Worldwide unit shipments of
PCs increased approximately 400,000 units to approximately
3.7 million units. Sales of broadcast- and professional-use
products increased as a result of favorable sales of high-
definition related products.
“Semiconductors” sales decreased by ¥5.5 billion, or 2.3%,
to ¥240.8 billion. The decrease was due to a decrease in sales of
CCDs as the result of pricing pressures.
“Components” sales increased by ¥37.3 billion, or 6.0%, to
¥656.8 billion. This increase was primarily due to an increase in
sales of lithium-ion batteries, primarily for use in PCs and power
tools, and Memory Sticks. On the other hand, sales of CD-R/RW
drives and optical pickups declined, primarily as a result of
significant unit price declines. Sales of DVD+/-R/RW drives
increased, despite a deterioration in unit selling prices, as a
result of a significant growth in units sold in association with
the expansion of the market.
“Other” sales decreased by ¥57.0 billion, or 9.6%, to ¥538.2
billion. This decrease was the result of a decrease in sales of
mobile phones, primarily to Sony Ericsson.
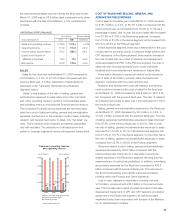
In the Electronics segment, cost of sales for the fiscal year
ended March 31, 2006 increased by ¥67.5 billion, or 1.6% to
¥4,184.5 billion compared with the previous fiscal year. The cost
of sales ratio deteriorated by 0.1% to 81.9% compared to
81.8% in the previous fiscal year. Although there was an
improvement in the cost of sales ratio for such products as
video cameras and PCs, products that contributed to the dete-
rioration in the cost of sales ratio included image sensors and
CRT televisions, which experienced decreased sales. Restruc-
turing charges recorded in cost of sales amounted to ¥23.8
billion, an increase of ¥14.2 billion compared with the ¥9.6 billion
recorded in the previous fiscal year. Research and development
costs decreased ¥15.2 billion, or 3.5%, from ¥433.3 billion in
the previous fiscal year to ¥418.1 billion.
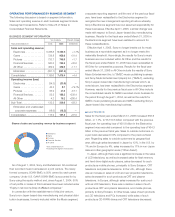
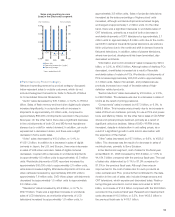
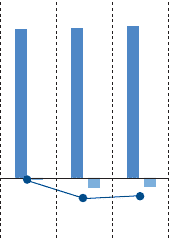
(Yen in billions) (Yen in billions)
Sales and operating income
(loss) in the Electronics segment
■ Sales (left)
■ Operating income (loss) (right)
● Operating margin
*Years ended March 31
6,000
4,000
2,000
0
–2,000
600
400
200
0
–200
2004 2005 2006
–0.7% –0.6%
–0.1%