Sony 2006 Annual Report Download - page 81
Download and view the complete annual report
Please find page 81 of the 2006 Sony annual report below. You can navigate through the pages in the report by either clicking on the pages listed below, or by using the keyword search tool below to find specific information within the annual report.-
 1
1 -
2
-
3
-
4
-
5
-
6
-
7
-
8
-
9
-
10
-
11
-
12
-
13
-
14
-
15
-
16
-
17
-
18
-
19
-
20
-
21
-
22
-
23
-
24
-
25
-
26
-
27
-
28
-
29
-
30
-
31
-
32
-
33
-
34
-
35
-
36
-
37
-
38
-
39
-
40
-
41
-
42
-
43
-
44
-
45
-
46
-
47
-
48
-
49
-
50
-
51
-
52
-
53
-
54
-
55
-
56
-
57
-
58
-
59
-
60
-
61
-
62
-
63
-
64
-
65
-
66
-
67
-
68
-
69
-
70
-
 71
71 -
 72
72 -
 73
73 -
 74
74 -
 75
75 -
 76
76 -
 77
77 -
 78
78 -
 79
79 -
 80
80 -
 81
81 -
 82
82 -
 83
83 -
 84
84 -
 85
85 -
 86
86 -
 87
87 -
 88
88 -
 89
89 -
 90
90 -
 91
91 -
92
-
93
-
94
-
95
-
96
-
97
-
98
-
99
-
100
-
101
-
102
-
103
-
104
-
105
-
106
-
107
-
108
-
109
-
110
-
111
-
112
-
113
-
114
-
115
-
116
-
117
-
118
-
119
-
120
-
121
-
122
-
123
-
124
-
125
-
126
-
127
-
128
-
129
-
130
-
131
-
132
-
133
-
134
-
135
-
136
-
137
-
138
-
139
-
140
-
141
-
142
-
143
-
144
-
145
-
146
 |
 |

79
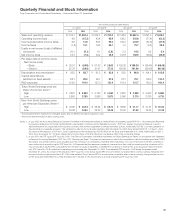
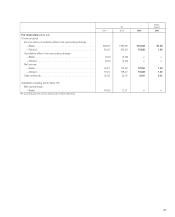
Five-Year Summary of Selected Financial Data
Sony Corporation and Consolidated Subsidiaries—Years ended March 31
Dollars in millions
Yen in millions except
except per share amounts per share amounts
2002 2003 2004 2005 2006 2006
FOR THE YEAR
Sales and operating revenue . . . .
¥7,578,258 ¥7,473,633 ¥7,496,391 ¥7,159,616 ¥ 7,475,436 $63,893
Operating income . . . . . . . . . . . .
134,631 185,440 98,902 113,919 191,255 1,635
Income before income taxes . . . .
92,775 247,621 144,067 157,207 286,329 2,447
Income taxes . . . . . . . . . . . . . . . .
65,211 80,831 52,774 16,044 176,515 1,508
Equity in net income (loss) of
affiliated companies . . . . . . . . . .
(34,472) (44,690) 1,714 29,039 13,176 113
Net income . . . . . . . . . . . . . . . . .
15,310 115,519 88,511 163,838 123,616 1,057
Per share data:
Common stock
Net income
—Basic . . . . . . . . . . . . . . .
¥ 16.72.¥ 125.74.¥ 95.97.¥ 175.90.¥ 122.58.$ 1.05.
—Diluted . . . . . . . . . . . . . .
16.67.118.21.87.00.158.07.116.88.1.00.
Cash dividends . . . . . . . . . . .
25.00.25.00.25.00.25.00.25.00.0.21.
Number of weighted-average
shares for basic
per share data
(thousands of shares) . . . . .
918,462 919,706 923,650 931,125 997,781
Subsidiary tracking stock
Net income (loss)
—Basic . . . . . . . . . . . . . . .
(15.87.)(41.98.)(41.80.)17.21.—.—
Number of weighted-average
shares for basic
per share data
(thousands of shares) . . . . .
3,072 3,072 3,072 3,072 —
Depreciation and amortization* . . .
¥ 354,135 ¥ 351,925 ¥ 366,269 ¥ 372,865 ¥ 381,843 $ 3,264
Capital expenditures
(additions to property,
plant and equipment) . . . . . . . . .
326,734 261,241 378,264 356,818 384,347 3,285
Research and development
expenses . . . . . . . . . . . . . . . . . .
433,214 443,128 514,483 502,008 531,795 4,545
AT YEAR-END
Net working capital . . . . . . . . . . .
¥ 778,716 ¥ 719,166 ¥ 381,140 ¥ 746,803 ¥ 569,296 $ 4,866
Stockholders’ equity . . . . . . . . . .
2,370,410 2,280,895 2,378,002 2,870,338 3,203,852 27,383
Stockholders’ equity per share
attributable to common stock . . .
¥ 2,570.31.¥ 2,466.81.¥ 2,563.67.¥ 2,872.21.¥ 3,200.85.$ 27.36.
Total assets . . . . . . . . . . . . . . . . .
¥8,185,795.¥8,370,545.¥9,090,662.¥9,499,100.¥10,607,753 $90,665
Number of shares issued at
year-end (thousands of shares):
Common stock. . . . . . . . . . . . .
919,744 922,385 926,418 997,211 1,001,680
Subsidiary tracking stock . . . . .
3,072 3,072 3,072 3,072 —
*Including amortization expenses for intangible assets and for deferred insurance acquisition costs