Sony 2006 Annual Report Download - page 89
Download and view the complete annual report
Please find page 89 of the 2006 Sony annual report below. You can navigate through the pages in the report by either clicking on the pages listed below, or by using the keyword search tool below to find specific information within the annual report.-
 1
1 -
2
-
3
-
4
-
5
-
6
-
7
-
8
-
9
-
10
-
11
-
12
-
13
-
14
-
15
-
16
-
17
-
18
-
19
-
20
-
21
-
22
-
23
-
24
-
25
-
26
-
27
-
28
-
29
-
30
-
31
-
32
-
33
-
34
-
35
-
36
-
37
-
38
-
39
-
40
-
41
-
42
-
43
-
44
-
45
-
46
-
47
-
48
-
49
-
50
-
51
-
52
-
53
-
54
-
55
-
56
-
57
-
58
-
59
-
60
-
61
-
62
-
63
-
64
-
65
-
66
-
67
-
68
-
69
-
70
-
71
-
72
-
73
-
74
-
75
-
76
-
77
-
78
-
 79
79 -
 80
80 -
 81
81 -
 82
82 -
 83
83 -
 84
84 -
 85
85 -
 86
86 -
 87
87 -
 88
88 -
 89
89 -
 90
90 -
 91
91 -
 92
92 -
 93
93 -
 94
94 -
 95
95 -
 96
96 -
 97
97 -
 98
98 -
 99
99 -
100
-
101
-
102
-
103
-
104
-
105
-
106
-
107
-
108
-
109
-
110
-
111
-
112
-
113
-
114
-
115
-
116
-
117
-
118
-
119
-
120
-
121
-
122
-
123
-
124
-
125
-
126
-
127
-
128
-
129
-
130
-
131
-
132
-
133
-
134
-
135
-
136
-
137
-
138
-
139
-
140
-
141
-
142
-
143
-
144
-
145
-
146
 |
 |

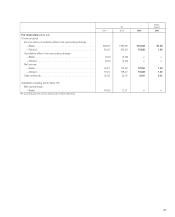
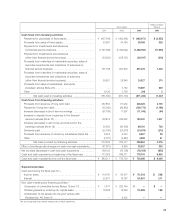
87
Dollars
Yen(Note 3)
2004 2005 2006 2006
Per share data (Note 22):
Common stock
Income before cumulative effect of an accounting change
—Basic . . . . . . . . . . . . . . . . . . . . . . . . . . . . . . . . . . . . . . . . . .
¥98.26.¥180.96.¥122.58.$1.05.
—Diluted . . . . . . . . . . . . . . . . . . . . . . . . . . . . . . . . . . . . . . . . .
89.03.162.59.116.88.1.00.
Cumulative effect of an accounting change
—Basic . . . . . . . . . . . . . . . . . . . . . . . . . . . . . . . . . . . . . . . . . .
(2.29.)(5.06.)——
—Diluted . . . . . . . . . . . . . . . . . . . . . . . . . . . . . . . . . . . . . . . . .
(2.03.)(4.52.)——
Net income
—Basic . . . . . . . . . . . . . . . . . . . . . . . . . . . . . . . . . . . . . . . . . .
95.97.175.90.122.58.1.05.
—Diluted . . . . . . . . . . . . . . . . . . . . . . . . . . . . . . . . . . . . . . . . .
87.00.158.07.116.88.1.00.
Cash dividends . . . . . . . . . . . . . . . . . . . . . . . . . . . . . . . . . . . . . .
25.00.25.00.25.00.0.21.
Subsidiary tracking stock (Note 16)
Net income (loss)
—Basic . . . . . . . . . . . . . . . . . . . . . . . . . . . . . . . . . . . . . . . . . .
(41.80.)17.21.——
The accompanying notes are an integral part of these statements.