Sony 2006 Annual Report Download - page 64
Download and view the complete annual report
Please find page 64 of the 2006 Sony annual report below. You can navigate through the pages in the report by either clicking on the pages listed below, or by using the keyword search tool below to find specific information within the annual report.-
 1
1 -
2
-
3
-
4
-
5
-
6
-
7
-
8
-
9
-
10
-
11
-
12
-
13
-
14
-
15
-
16
-
17
-
18
-
19
-
20
-
21
-
22
-
23
-
24
-
25
-
26
-
27
-
28
-
29
-
30
-
31
-
32
-
33
-
34
-
35
-
36
-
37
-
38
-
39
-
40
-
41
-
42
-
43
-
44
-
45
-
46
-
47
-
48
-
49
-
50
-
51
-
52
-
53
-
 54
54 -
 55
55 -
 56
56 -
 57
57 -
 58
58 -
 59
59 -
 60
60 -
 61
61 -
 62
62 -
 63
63 -
 64
64 -
 65
65 -
 66
66 -
 67
67 -
 68
68 -
 69
69 -
 70
70 -
 71
71 -
 72
72 -
 73
73 -
 74
74 -
75
-
76
-
77
-
78
-
79
-
80
-
81
-
82
-
83
-
84
-
85
-
86
-
87
-
88
-
89
-
90
-
91
-
92
-
93
-
94
-
95
-
96
-
97
-
98
-
99
-
100
-
101
-
102
-
103
-
104
-
105
-
106
-
107
-
108
-
109
-
110
-
111
-
112
-
113
-
114
-
115
-
116
-
117
-
118
-
119
-
120
-
121
-
122
-
123
-
124
-
125
-
126
-
127
-
128
-
129
-
130
-
131
-
132
-
133
-
134
-
135
-
136
-
137
-
138
-
139
-
140
-
141
-
142
-
143
-
144
-
145
-
146
 |
 |
62
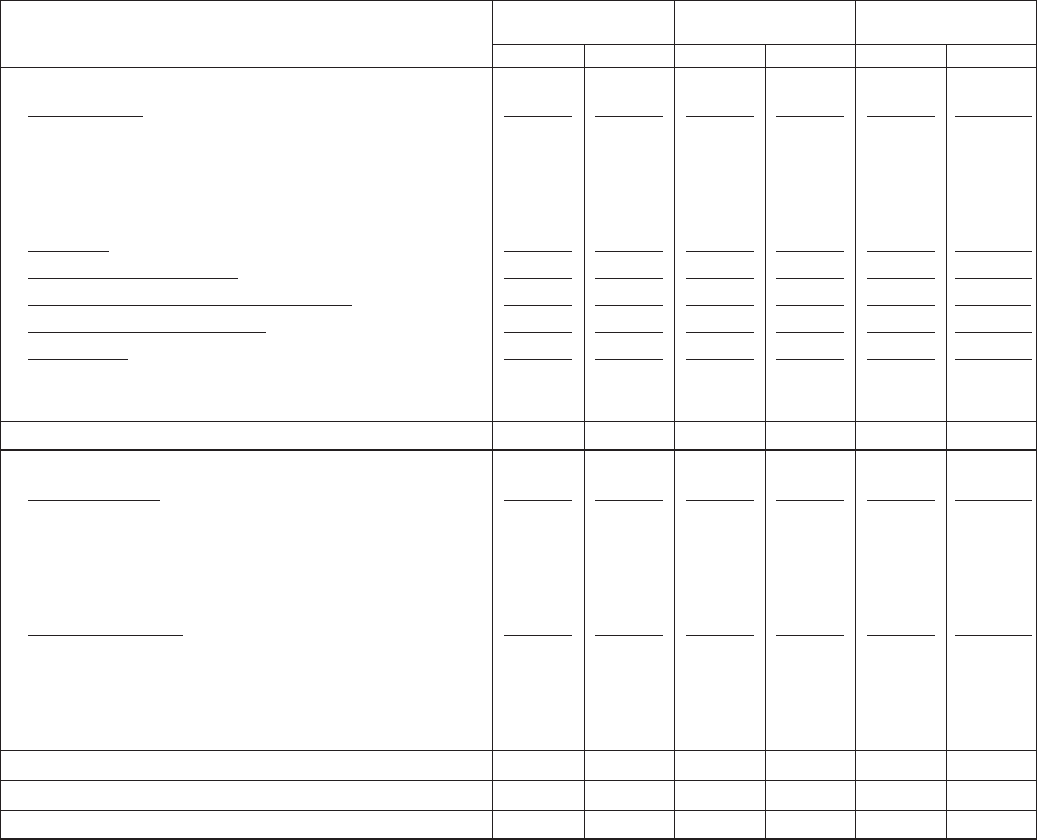
CONDENSED BALANCE SHEETS SEPARATING OUT THE
FINANCIAL SERVICES SEGMENT (UNAUDITED)
The following schedule shows an unaudited condensed balance
sheet for the Financial Services segment and all other segments
excluding Financial Services as well as the condensed
consolidated balance sheet. This presentation is not required
under U.S. GAAP, which is used in Sony’s consolidated financial
INVESTMENTS
Sony regularly evaluates its investment portfolio to identify other-
than-temporary impairments of individual securities. Factors that
are considered by Sony in determining whether an other-than-
temporary decline in value has occurred include: the length of
time and extent to which the market value of the security has
been less than its original cost, the financial condition, operating
results, business plans and estimated future cash flows of the
issuer of the security, other specific factors affecting the market
value, deterioration of issuer’s credit condition, sovereign risk,
and whether or not Sony is able to retain the investment for a
period of time sufficient to allow for the anticipated recovery in
market value.
statements. However, because the Financial Services segment
is different in nature from Sony’s other segments, Sony believes
that a comparative presentation may be useful in understanding
and analyzing Sony’s consolidated financial statements.
Transactions between the Financial Services segment and all
other segments excluding Financial Services are eliminated in
the consolidated figures shown below.
CONDENSED BALANCE SHEETS SEPARATING OUT THE FINANCIAL SERVICES SEGMENT (UNAUDITED)
Yen in millions
Sony without
Financial Services Financial Services Consolidated
Years ended March 31 2005 2006 2005 2006 2005 2006
Assets
Current assets . . . . . . . . . . . . . . . . . . . . . . . . . . . . . . . . . . . .
990,191 851,454 2,592,849 2,956,522 3,556,171 3,769,524
Cash and cash equivalents . . . . . . . . . . . . . . . . . . . . . . . . . . .
259,371 117,630 519,732 585,468 779,103 703,098
Marketable securities . . . . . . . . . . . . . . . . . . . . . . . . . . . . . . . .
456,130 532,895 4,072 4,073 460,202 536,968
Notes and accounts receivable, trade . . . . . . . . . . . . . . . . . . .
77,023 17,236 952,692 973,675 1,025,362 985,508
Other . . . . . . . . . . . . . . . . . . . . . . . . . . . . . . . . . . . . . . . . . . . .
197,667 183,693 1,116,353 1,393,306 1,291,504 1,543,950
Film costs . . . . . . . . . . . . . . . . . . . . . . . . . . . . . . . . . . . . . . . .
—
— 278,961 360,372 278,961 360,372
Investments and advances . . . . . . . . . . . . . . . . . . . . . . . . . .
2,378,966 3,128,748 445,446 477,089 2,745,689 3,519,907
Investments in Financial Services, at cost . . . . . . . . . . . . . .
—
— 187,400 187,400
—
—
Property, plant and equipment . . . . . . . . . . . . . . . . . . . . . . .
38,551 37,422 1,333,848 1,351,125 1,372,399 1,388,547
Other assets . . . . . . . . . . . . . . . . . . . . . . . . . . . . . . . . . . . . . .
477,809 547,983 1,189,398 1,059,786 1,545,880 1,569,403
Deferred insurance acquisition costs . . . . . . . . . . . . . . . . . . . .
374,805 383,156 —
—374,805 383,156
Other . . . . . . . . . . . . . . . . . . . . . . . . . . . . . . . . . . . . . . . . . . . .
103,004 164,827 1,189,398 1,059,786 1,171,075 1,186,247
. . . . . . . . . . . . . . . . . . . . . . . . . . . . . . . . . . . . . . . . . . . . . . . .
3,885,517 4,565,607 6,027,902 6,392,294 9,499,100 10,607,753
Liabilities and stockholders’ equity
Current liabilities . . . . . . . . . . . . . . . . . . . . . . . . . . . . . . . . . .
708,613 918,338 2,137,480 2,329,285 2,809,368 3,200,228
Short-term borrowings . . . . . . . . . . . . . . . . . . . . . . . . . . . . . . .
45,358 136,723 204,027 225,082 230,266 336,321
Notes and accounts payable, trade . . . . . . . . . . . . . . . . . . . . .
7,099 11,707 801,252 804,394 806,044 813,332
Deposits from customers in the banking business . . . . . . . . . .
546,718 599,952 —
—546,718 599,952
Other . . . . . . . . . . . . . . . . . . . . . . . . . . . . . . . . . . . . . . . . . . . .
109,438 169,956 1,132,201 1,299,809 1,226,340 1,450,623
Long-term liabilities . . . . . . . . . . . . . . . . . . . . . . . . . . . . . . . .
2,756,679 3,059,251 1,228,927 1,222,597 3,795,547 4,166,572
Long-term debt . . . . . . . . . . . . . . . . . . . . . . . . . . . . . . . . . . . .
135,750 128,097 627,367 701,372 678,992 764,898
Accrued pension and severance costs . . . . . . . . . . . . . . . . . . .
14,362 13,479 338,040 168,768 352,402 182,247
Future insurance policy benefits and other . . . . . . . . . . . . . . . .
2,464,295 2,744,321 ——2,464,295 2,744,321
Other . . . . . . . . . . . . . . . . . . . . . . . . . . . . . . . . . . . . . . . . . . . .
142,272 173,354 263,520 352,457 299,858 475,106
Minority interest in consolidated subsidiaries . . . . . . . . . . .
5,476 4,089 18,471 32,623 23,847 37,101
Stockholders’ equity . . . . . . . . . . . . . . . . . . . . . . . . . . . . . . .
414,749 583,929 2,643,024 2,807,789 2,870,338 3,203,852
. . . . . . . . . . . . . . . . . . . . . . . . . . . . . . . . . . . . . . . . . . . . . . . .
3,885,517 4,565,607 6,027,902 6,392,294 9,499,100 10,607,753