Sony 2006 Annual Report Download - page 84
Download and view the complete annual report
Please find page 84 of the 2006 Sony annual report below. You can navigate through the pages in the report by either clicking on the pages listed below, or by using the keyword search tool below to find specific information within the annual report.-
 1
1 -
2
-
3
-
4
-
5
-
6
-
7
-
8
-
9
-
10
-
11
-
12
-
13
-
14
-
15
-
16
-
17
-
18
-
19
-
20
-
21
-
22
-
23
-
24
-
25
-
26
-
27
-
28
-
29
-
30
-
31
-
32
-
33
-
34
-
35
-
36
-
37
-
38
-
39
-
40
-
41
-
42
-
43
-
44
-
45
-
46
-
47
-
48
-
49
-
50
-
51
-
52
-
53
-
54
-
55
-
56
-
57
-
58
-
59
-
60
-
61
-
62
-
63
-
64
-
65
-
66
-
67
-
68
-
69
-
70
-
71
-
72
-
73
-
 74
74 -
 75
75 -
 76
76 -
 77
77 -
 78
78 -
 79
79 -
 80
80 -
 81
81 -
 82
82 -
 83
83 -
 84
84 -
 85
85 -
 86
86 -
 87
87 -
 88
88 -
 89
89 -
 90
90 -
 91
91 -
 92
92 -
 93
93 -
 94
94 -
95
-
96
-
97
-
98
-
99
-
100
-
101
-
102
-
103
-
104
-
105
-
106
-
107
-
108
-
109
-
110
-
111
-
112
-
113
-
114
-
115
-
116
-
117
-
118
-
119
-
120
-
121
-
122
-
123
-
124
-
125
-
126
-
127
-
128
-
129
-
130
-
131
-
132
-
133
-
134
-
135
-
136
-
137
-
138
-
139
-
140
-
141
-
142
-
143
-
144
-
145
-
146
 |
 |

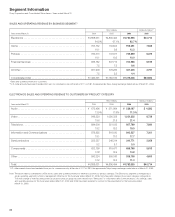
82
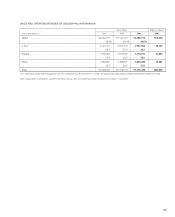
SALES AND OPERATING REVENUE BY BUSINESS SEGMENT*
Yen in millions Dollars in millions**
Years ended March 31 2004 2005 2006 2006
Electronics . . . . . . . . . . . . . . . . . . . . . . . . . . . . . . . . . . . . . . . . . . .
¥4,858,631 ¥4,806,494 ¥4,763,555 $40,714
. . . . . . . . . . . . . . . . . . . . . . . . . . . . . . . . . . . . . . . . . . . . . . . . . . .
64.8.%67.1.%63.7.%
Game . . . . . . . . . . . . . . . . . . . . . . . . . . . . . . . . . . . . . . . . . . . . . .
753,732 702,524 918,251 7,848
. . . . . . . . . . . . . . . . . . . . . . . . . . . . . . . . . . . . . . . . . . . . . . . . . . .
10.1.9.8.12.3.
Pictures . . . . . . . . . . . . . . . . . . . . . . . . . . . . . . . . . . . . . . . . . . . . .
756,370 733,677 745,859 6,375
. . . . . . . . . . . . . . . . . . . . . . . . . . . . . . . . . . . . . . . . . . . . . . . . . . .
10.1.10.3.10.0.
Financial Services . . . . . . . . . . . . . . . . . . . . . . . . . . . . . . . . . . . . .
565,752 537,715 720,566 6,159
. . . . . . . . . . . . . . . . . . . . . . . . . . . . . . . . . . . . . . . . . . . . . . . . . . .
7.5.7.5.9.6.
All Other . . . . . . . . . . . . . . . . . . . . . . . . . . . . . . . . . . . . . . . . . . . . .
561,906 379,206 327,205 2,797
. . . . . . . . . . . . . . . . . . . . . . . . . . . . . . . . . . . . . . . . . . . . . . . . . . .
7.5.5.3.4.4.
Consolidated total . . . . . . . . . . . . . . . . . . . . . . . . . . . . . . . . . . . . .
¥7,496,391 ¥7,159,616 ¥7,475,436 $63,893
**Sales and operating revenue to customers
**U.S. dollar amounts have been translated from yen, for convenience only, at the rate of ¥117=U.S.$1, the approximate Tokyo foreign exchange market rate as of March 31, 2006.
Segment Information
Sony Corporation and Consolidated Subsidiaries—Years ended March 31
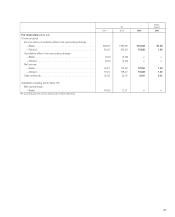
ELECTRONICS SALES AND OPERATING REVENUE TO CUSTOMERS BY PRODUCT CATEGORY
Yen in millions Dollars in millions*
Years ended March 31 2004 2005 2006 2006
Audio . . . . . . . . . . . . . . . . . . . . . . . . . . . . . . . . . . . . . . . . . . . . . . .
¥ 675,496 ¥ 571,864 ¥ 536,187 $ 4,583
. . . . . . . . . . . . . . . . . . . . . . . . . . . . . . . . . . . . . . . . . . . . . . . . . . . . . . . . . 13.9.%11.9.%11.3.%
Video . . . . . . . . . . . . . . . . . . . . . . . . . . . . . . . . . . . . . . . . . . . . . . .
949,320 1,036,328 1,021,325 8,729
. . . . . . . . . . . . . . . . . . . . . . . . . . . . . . . . . . . . . . . . . . . . . . . . . . .
19.6.21.5.21.4.
Televisions . . . . . . . . . . . . . . . . . . . . . . . . . . . . . . . . . . . . . . . . . . .
884,600 921,195 927,769 7,930
. . . . . . . . . . . . . . . . . . . . . . . . . . . . . . . . . . . . . . . . . . . . . . . . . . .
18.2.19.2.19.5.
Information and Communications . . . . . . . . . . . . . . . . . . . . . . . . .
878,855 816,150 842,537 7,201
. . . . . . . . . . . . . . . . . . . . . . . . . . . . . . . . . . . . . . . . . . . . . . . . . . .
18.1.17.0.17.7.
Semiconductors . . . . . . . . . . . . . . . . . . . . . . . . . . . . . . . . . . . . . .
253,237 246,314 240,771 2,058
. . . . . . . . . . . . . . . . . . . . . . . . . . . . . . . . . . . . . . . . . . . . . . . . . . .
5.2.5.1.5.0.
Components . . . . . . . . . . . . . . . . . . . . . . . . . . . . . . . . . . . . . . . . .
623,799 619,477 656,768 5,613
. . . . . . . . . . . . . . . . . . . . . . . . . . . . . . . . . . . . . . . . . . . . . . . . . . .
12.8.12.9.13.8.
Other . . . . . . . . . . . . . . . . . . . . . . . . . . . . . . . . . . . . . . . . . . . . . . .
593,324 595,166 538,198 4,600
. . . . . . . . . . . . . . . . . . . . . . . . . . . . . . . . . . . . . . . . . . . . . . . . . . .
12.2.12.4.11.3.
Total . . . . . . . . . . . . . . . . . . . . . . . . . . . . . . . . . . . . . . . . . . . . . . . .
¥4,858,631 ¥4,806,494 ¥4,763,555 $40,714
*U.S. dollar amounts have been translated from yen, for convenience only, at the rate of ¥117=U.S.$1, the approximate Tokyo foreign exchange market rate as of March 31, 2006.
Note: The above table is a breakdown of Electronics sales and operating revenue to external customers by product category. The Electronics segment is managed as a
single operating segment by Sony’s management. Effective for the fiscal year ended March 31, 2006, Sony has partly changed its product category configuration.
The main change is that the professional-use projector product group has been moved from “Televisions” to “Information and Communications”. Accordingly, sales
and operating revenue for the fiscal years ended March 31, 2004 and 2005 have been restated to conform to the presentation for the fiscal year ended
March 31, 2006.