Sony 2006 Annual Report Download - page 88
Download and view the complete annual report
Please find page 88 of the 2006 Sony annual report below. You can navigate through the pages in the report by either clicking on the pages listed below, or by using the keyword search tool below to find specific information within the annual report.-
 1
1 -
2
-
3
-
4
-
5
-
6
-
7
-
8
-
9
-
10
-
11
-
12
-
13
-
14
-
15
-
16
-
17
-
18
-
19
-
20
-
21
-
22
-
23
-
24
-
25
-
26
-
27
-
28
-
29
-
30
-
31
-
32
-
33
-
34
-
35
-
36
-
37
-
38
-
39
-
40
-
41
-
42
-
43
-
44
-
45
-
46
-
47
-
48
-
49
-
50
-
51
-
52
-
53
-
54
-
55
-
56
-
57
-
58
-
59
-
60
-
61
-
62
-
63
-
64
-
65
-
66
-
67
-
68
-
69
-
70
-
71
-
72
-
73
-
74
-
75
-
76
-
77
-
 78
78 -
 79
79 -
 80
80 -
 81
81 -
 82
82 -
 83
83 -
 84
84 -
 85
85 -
 86
86 -
 87
87 -
 88
88 -
 89
89 -
 90
90 -
 91
91 -
 92
92 -
 93
93 -
 94
94 -
 95
95 -
 96
96 -
 97
97 -
 98
98 -
99
-
100
-
101
-
102
-
103
-
104
-
105
-
106
-
107
-
108
-
109
-
110
-
111
-
112
-
113
-
114
-
115
-
116
-
117
-
118
-
119
-
120
-
121
-
122
-
123
-
124
-
125
-
126
-
127
-
128
-
129
-
130
-
131
-
132
-
133
-
134
-
135
-
136
-
137
-
138
-
139
-
140
-
141
-
142
-
143
-
144
-
145
-
146
 |
 |

86
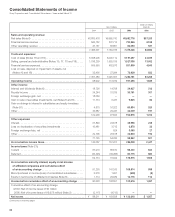
Consolidated Statements of Income
Sony Corporation and Consolidated Subsidiaries—Years ended March 31
Dollars in millions
Yen in millions (Note 3)
2004 2005 2006 2006
Sales and operating revenue:
Net sales (Note 6) . . . . . . . . . . . . . . . . . . . . . . . . . . . . . . . . . . . . .
¥6,883,478 ¥6,565,010 ¥6,692,776 $57,203
Financial service revenue . . . . . . . . . . . . . . . . . . . . . . . . . . . . . . . .
565,752 537,715 720,566 6,159
Other operating revenue . . . . . . . . . . . . . . . . . . . . . . . . . . . . . . . .
47,161 56,891 62,094 531
. . . . . . . . . . . . . . . . . . . . . . . . . . . . . . . . . . . . . . . . . . . . . . . . . . .
7,496,391 7,159,616 7,475,436 63,893
Costs and expenses:
Cost of sales (Notes 18 and 19) . . . . . . . . . . . . . . . . . . . . . . . . . . .
5,058,205 5,000,112 5,151,397 44,029
Selling, general and administrative (Notes 15, 17, 18 and 19). . . . .
1,798,239 1,535,015 1,527,036 13,052
Financial service expenses . . . . . . . . . . . . . . . . . . . . . . . . . . . . . . .
505,550 482,576 531,809 4,545
Loss on sale, disposal or impairment of assets, net
(Notes 10 and 18) . . . . . . . . . . . . . . . . . . . . . . . . . . . . . . . . . . . .
35,495 27,994 73,939 632
. . . . . . . . . . . . . . . . . . . . . . . . . . . . . . . . . . . . . . . . . . . . . . . . . . .
7,397,489 7,045,697 7,284,181 62,258
Operating income . . . . . . . . . . . . . . . . . . . . . . . . . . . . . . . . . . . .
98,902 113,919 191,255 1,635
Other income:
Interest and dividends (Note 6). . . . . . . . . . . . . . . . . . . . . . . . . . . .
18,756 14,708 24,937 213
Royalty income . . . . . . . . . . . . . . . . . . . . . . . . . . . . . . . . . . . . . . .
34,244 31,709 35,161 301
Foreign exchange gain, net . . . . . . . . . . . . . . . . . . . . . . . . . . . . . .
18,059
———
Gain on sale of securities investments, net (Notes 6 and 8) . . . . . .
11,774 5,437 9,645 82
Gain on change in interest in subsidiaries and equity investees
(Note 20) . . . . . . . . . . . . . . . . . . . . . . . . . . . . . . . . . . . . . . . . . . .
4,870 16,322 60,834 520
Other . . . . . . . . . . . . . . . . . . . . . . . . . . . . . . . . . . . . . . . . . . . . . . .
34,587 29,447 23,039 197
. . . . . . . . . . . . . . . . . . . . . . . . . . . . . . . . . . . . . . . . . . . . . . . . . . .
122,290 97,623 153,616 1,313
Other expenses:
Interest . . . . . . . . . . . . . . . . . . . . . . . . . . . . . . . . . . . . . . . . . . . . .
27,849 24,578 28,996 248
Loss on devaluation of securities investments . . . . . . . . . . . . . . . .
16,481 3,715 3,878 33
Foreign exchange loss, net . . . . . . . . . . . . . . . . . . . . . . . . . . . . . .
—524 3,065 27
Other . . . . . . . . . . . . . . . . . . . . . . . . . . . . . . . . . . . . . . . . . . . . . . .
32,795 25,518 22,603 193
. . . . . . . . . . . . . . . . . . . . . . . . . . . . . . . . . . . . . . . . . . . . . . . . . . .
77,125 54,335 58,542 501
Income before income taxes. . . . . . . . . . . . . . . . . . . . . . . . . . . .
144,067 157,207 286,329 2,447
Income taxes (Note 21):
Current . . . . . . . . . . . . . . . . . . . . . . . . . . . . . . . . . . . . . . . . . . . . .
87,219 85,510 96,400 824
Deferred. . . . . . . . . . . . . . . . . . . . . . . . . . . . . . . . . . . . . . . . . . . . .
(34,445) (69,466) 80,115 684
. . . . . . . . . . . . . . . . . . . . . . . . . . . . . . . . . . . . . . . . . . . . . . . . . . .
52,774 16,044 176,515 1,508
Income before minority interest, equity in net income
of affiliated companies and cumulative effect
of an accounting change . . . . . . . . . . . . . . . . . . . . . . . . . . . . . .
91,293 141,163 109,814 939
Minority interest in income (loss) of consolidated subsidiaries . . . . .
2,379 1,651 (626) (5)
Equity in net income of affiliated companies (Note 6) . . . . . . . . . . .
1,714 29,039 13,176 113
Income before cumulative effect of an accounting change . . . .
90,628 168,551 123,616 1,057
Cumulative effect of an accounting change
(2004: Net of income taxes of ¥0 million
(2005: Net of income taxes of ¥2,675 million) (Note 2) . . . . . . . .
(2,117) (4,713) ——
Net income . . . . . . . . . . . . . . . . . . . . . . . . . . . . . . . . . . . . . . . . . . . . . . . . ¥0,088,511 ¥0,163,838 ¥ 123,616 $ 1,057
(Continued on following page)