Sony 2006 Annual Report Download - page 83
Download and view the complete annual report
Please find page 83 of the 2006 Sony annual report below. You can navigate through the pages in the report by either clicking on the pages listed below, or by using the keyword search tool below to find specific information within the annual report.-
 1
1 -
2
-
3
-
4
-
5
-
6
-
7
-
8
-
9
-
10
-
11
-
12
-
13
-
14
-
15
-
16
-
17
-
18
-
19
-
20
-
21
-
22
-
23
-
24
-
25
-
26
-
27
-
28
-
29
-
30
-
31
-
32
-
33
-
34
-
35
-
36
-
37
-
38
-
39
-
40
-
41
-
42
-
43
-
44
-
45
-
46
-
47
-
48
-
49
-
50
-
51
-
52
-
53
-
54
-
55
-
56
-
57
-
58
-
59
-
60
-
61
-
62
-
63
-
64
-
65
-
66
-
67
-
68
-
69
-
70
-
71
-
72
-
 73
73 -
 74
74 -
 75
75 -
 76
76 -
 77
77 -
 78
78 -
 79
79 -
 80
80 -
 81
81 -
 82
82 -
 83
83 -
 84
84 -
 85
85 -
 86
86 -
 87
87 -
 88
88 -
 89
89 -
 90
90 -
 91
91 -
 92
92 -
 93
93 -
94
-
95
-
96
-
97
-
98
-
99
-
100
-
101
-
102
-
103
-
104
-
105
-
106
-
107
-
108
-
109
-
110
-
111
-
112
-
113
-
114
-
115
-
116
-
117
-
118
-
119
-
120
-
121
-
122
-
123
-
124
-
125
-
126
-
127
-
128
-
129
-
130
-
131
-
132
-
133
-
134
-
135
-
136
-
137
-
138
-
139
-
140
-
141
-
142
-
143
-
144
-
145
-
146
 |
 |

81
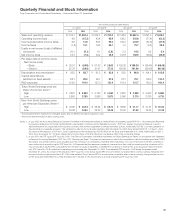
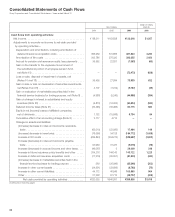
Quarterly Financial and Stock Information
Sony Corporation and Consolidated Subsidiaries—Years ended March 31 (Unaudited)
.
Yen in billions except per share amounts
1st quarter 2nd quarter 3rd quarter 4th quarter
2005 2006 2005 2006 2005 2006 2005 2006
Sales and operating revenue . . . . . . .
¥1,612.1.¥1,559.4.¥1,702.3.¥1,703.0.¥2,148.2.¥2,367.6.¥1,697.0.¥1,845.4.
Operating income (loss) . . . . . . . . . . .
9.8.(15.3.)43.4.65.9.138.2.202.8.(77.4.)(62.2.)
Income (loss) before income taxes . . .
6.6.12.9.63.3.95.4.149.2.225.9.(61.9.)(47.9.)
Income taxes . . . . . . . . . . . . . . . . . . .
(1.8.)12.1.16.2.65.1.7.0.75.7.(5.3.)23.6.
Equity in net income (loss) of affiliated
companies . . . . . . . . . . . . . . . . . . . .
20.1.(9.1.)6.1.(2.6.).2.3.19.5.0.5.5.4.
Net income (loss) . . . . . . . . . . . . . . . .
23.3.(7.3.)53.2.28.5.143.8.168.9.(56.5.)(66.5.)
Per share data of common stock
Net income (loss)
—Basic . . . . . . . . . . . . . . . . . . . .
¥ 25.10.¥ (8.68.)¥ 57.50.¥ 28.63.¥ 155.32.¥ 169.36.¥ (59.40.)¥ (66.48.)
—Diluted . . . . . . . . . . . . . . . . . . .
22.79.(8.68.)51.47.27.32.138.08.161.60.(59.40.)(66.48.)
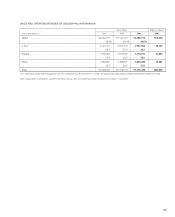
Depreciation and amortization* . . . . .
¥ 85.5.¥ 88.7.¥ 91.2.¥ 92.8.¥ 92.0.¥ 96.8.¥ 104.1.¥ 103.6.
Capital expenditures
(additions to fixed assets) . . . . . . . . .
88.1.98.0.90.1.87.8.78.7.76.1.100.0.122.4.
R&D expenses . . . . . . . . . . . . . . . . . .
123.6.118.4.127.0.131.4.119.4.121.7.132.0.160.4.
Tokyo Stock Exchange price per
share of common stock**:
High . . . . . . . . . . . . . . . . . . . . . . . .
¥ 4,670 ¥ 4,390.¥ 4,160 ¥ 4,060 ¥ 3,970 ¥ 4,880.¥ 4,400 ¥ 5,860
Low . . . . . . . . . . . . . . . . . . . . . . . .
3,890 3,780.3,590 3,670 3,650 3,710.3,760 4,730
New York Stock Exchange price
per American Depositary Share**:
High . . . . . . . . . . . . . . . . . . . . . . . .
$ 43.66.$ 40.54.$ 38.44.$ 36.70.$ 38.96.$ 41.17.$ 41.47.$ 50.30.
Low . . . . . . . . . . . . . . . . . . . . . . . .
34.08.34.44.32.50.32.45.34.02.31.82.36.34.41.36.
*Including amortization expenses for intangible assets and for deferred insurance acquisition costs
** Stock price data are based on daily closing prices.
Notes: 1. In July 2003, the Accounting Standards Executive Committee of the American Institute of Certified Public Accountants issued SOP 03-1, “Accounting and Reporting
by Insurance Enterprises for Certain Nontraditional Long-Duration Contracts and for Separate Accounts”. SOP 03-1 requires insurance enterprises to record
additional reserves for long-duration life insurance contracts with minimum guarantee or annuity receivable options. Additionally, SOP 03-1 provides guidance for
the presentation of separate accounts. This statement is effective for fiscal years beginning after December 15, 2003. Sony adopted SOP 03-1 on April 1, 2004.
As a result of the adoption of SOP 03-1, Sony’s operating income decreased by ¥5,156 million for the fiscal year ended March 31, 2005. Additionally, on April 1,
2004, Sony recorded a ¥4,713 million charge (net of income taxes of ¥2,675 million) as a cumulative effect of an accounting change.
2. In July 2004, the EITF issued EITF Issue No. 04-8, “The Effect of Contingently Convertible Instruments on Diluted Earnings per Share”. In accordance with Statement
of Financial Accounting Standards (‘‘FAS’’) No. 128, ‘‘Earnings per Share’’, Sony had not previously included in the computation of diluted earnings per share (‘‘EPS’’)
the number of potential common stock issuable upon the conversion of contingently convertible debt instruments (‘‘Co-Cos’’) that had not met the conditions to
exercise the stock acquisition rights. EITF Issue No. 04-8 requires that the maximum number of common stock that could be issued upon the conversion of Co-
Cos be included in diluted EPS computations from the date of issuance regardless of whether the conditions to exercise the stock acquisition rights have been
met. EITF Issue No. 04-8 is effective for reporting periods ending after December 15, 2004. Sony adopted EITF Issue No. 04-8 during the quarter ended
December 31, 2004. As a result of the adoption of EITF Issue No. 04-8, Sony’s diluted EPS of income before cumulative effect of an accounting change and net
income for the fiscal year ended March 31, 2004 were restated. Sony’s diluted EPS of income before cumulative effect of an accounting change and net income
for the fiscal year ended March 31, 2005 decreased by ¥7.26 and ¥7.06, respectively, as a result of adopting EITF Issue No. 04-8.