Toyota 2011 Annual Report Download - page 101
Download and view the complete annual report
Please find page 101 of the 2011 Toyota annual report below. You can navigate through the pages in the report by either clicking on the pages listed below, or by using the keyword search tool below to find specific information within the annual report.-
 1
1 -
2
-
3
-
4
-
5
-
6
-
7
-
8
-
9
-
10
-
11
-
12
-
13
-
14
-
15
-
16
-
17
-
18
-
19
-
20
-
21
-
22
-
23
-
24
-
25
-
26
-
27
-
28
-
29
-
30
-
31
-
32
-
33
-
34
-
35
-
36
-
37
-
38
-
39
-
40
-
41
-
42
-
43
-
44
-
45
-
46
-
47
-
48
-
49
-
50
-
51
-
52
-
53
-
54
-
55
-
56
-
57
-
58
-
59
-
60
-
61
-
62
-
63
-
64
-
65
-
66
-
67
-
68
-
69
-
70
-
71
-
72
-
73
-
74
-
75
-
76
-
77
-
78
-
79
-
80
-
81
-
82
-
83
-
84
-
85
-
86
-
87
-
88
-
89
-
90
-
 91
91 -
 92
92 -
 93
93 -
 94
94 -
 95
95 -
 96
96 -
 97
97 -
 98
98 -
 99
99 -
 100
100 -
 101
101 -
 102
102 -
 103
103 -
 104
104 -
 105
105 -
 106
106 -
 107
107 -
 108
108 -
 109
109 -
 110
110 -
 111
111 -
112
-
113
 |
 |

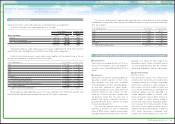
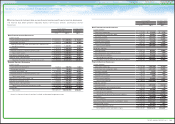
Segment data:
24
0822
Financial Section and
Investor Information
Business and
Performance Review
Special FeatureMessage/Vision
Management and
Corporate Information
Notes to Consolidated Financial Statements
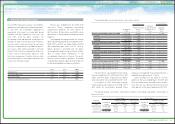
The operating segments reported below are the
segments of Toyota for which separate financial
information is available and for which operating
income/loss amounts are evaluated regularly by
executive management in deciding how to allocate
resources and in assessing performance.
The major portions of Toyota’s operations on
a worldwide basis are derived from the Automo-
tive and Financial Services business segments.
The Automotive segment designs, manufactures
and distributes sedans, minivans, compact cars,
sport-utility vehicles, trucks and related parts and
accessories. The Financial Services segment
As of and for the year ended March 31, 2009:
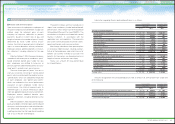
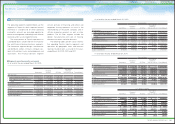
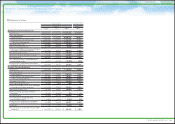
As of and for the year ended March 31, 2010:
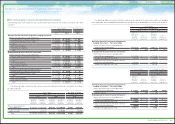
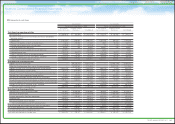
As of and for the year ended March 31, 2011:
consists primarily of financing, and vehicle and
equipment leasing operations to assist in the
merchandising of the parent company and its
affiliate companies products as well as other
products. The All Other segment includes the
design, manufacturing and sales of housing,
telecommunications and other business.
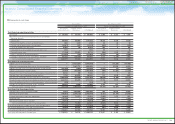
The following tables present certain informa-
tion regarding Toyota’s industry segments and
operations by geographic areas and overseas
revenues by destination as of and for the years
ended March 31, 2009, 2010 and 2011.
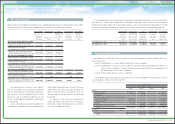
Segment operating results and assets
Yen in millions
Automotive
Financial
Services All Other
Inter-segment
Elimination/
Unallocated Amount
Consolidated
Net revenues
Sales to external customers ¥17,187,308 ¥ 1,226,244 ¥ 537,421 ¥ — ¥18,950,973
Inter-segment sales and transfers 10,120 19,163 410,194 (439,477) —
Total 17,197,428 1,245,407 947,615 (439,477) 18,950,973
Operating expenses 17,283,798 998,480 956,475 (435,296) 18,803,457
Operating income (loss) ¥ (86,370) ¥ 246,927 ¥ (8,860) ¥ (4,181) ¥ 147,516
Assets ¥12,359,404 ¥13,274,953 ¥1,119,635 ¥3,595,295 ¥30,349,287
Investment in equity method investees 1,692,702 129,745 — 44,993 1,867,440
Depreciation expense 1,018,935 348,820 46,814 — 1,414,569
Capital expenditure 616,216 774,102 21,751 25,532 1,437,601
Yen in millions
Automotive
Financial
Services All Other
Inter-segment
Elimination/
Unallocated Amount
Consolidated
Net revenues
Sales to external customers ¥17,322,753 ¥ 1,173,168 ¥ 497,767 ¥ — ¥18,993,688
Inter-segment sales and transfers 14,567 19,037 474,485 (508,089) —
Total 17,337,320 1,192,205 972,252 (508,089) 18,993,688
Operating expenses 17,251,347 833,925 937,010 (496,873) 18,525,409
Operating income (loss) ¥ 85,973 ¥ 358,280 ¥ 35,242 ¥ (11,216) ¥ 468,279
Assets ¥11,341,558 ¥13,365,394 ¥1,146,720 ¥3,964,494 ¥29,818,166
Investment in equity method investees 1,784,539 3,519 3,045 26,885 1,817,988
Depreciation expense 819,075 330,865 25,633 — 1,175,573
Capital expenditure 691,867 991,330 21,058 (13,064) 1,691,191
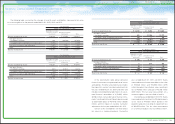
U.S. dollars in millions
Automotive
Financial
Services All Other
Inter-segment
Elimination/
Unallocated Amount
Consolidated
Net revenues
Sales to external customers $208,331 $ 14,109 $ 5,987 $ — $228,427
Inter-segment sales and transfers 176 229 5,706 (6,111) —
Total 208,507 14,338 11,693 (6,111) 228,427
Operating expenses 207,473 10,029 11,269 (5,976) 222,795
Operating income (loss) $ 1,034 $ 4,309 $ 424 $ (135) $ 5,632
Assets $136,399 $160,738 $13,791 $47,679 $358,607
Investment in equity method investees 21,462 42 37 323 21,864
Depreciation expense 9,851 3,979 308 — 14,138
Capital expenditure 8,321 11,922 253 (157) 20,339
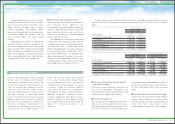
Yen in millions
Automotive
Financial
Services All Other
Inter-segment
Elimination/
Unallocated Amount
Consolidated
Net revenues
Sales to external customers ¥18,550,501 ¥ 1,355,850 ¥ 623,219 ¥ — ¥20,529,570
Inter-segment sales and transfers 14,222 21,698 561,728 (597,648) —
Total 18,564,723 1,377,548 1,184,947 (597,648) 20,529,570
Operating expenses 18,959,599 1,449,495 1,175,034 (593,547) 20,990,581
Operating income (loss) ¥ (394,876) ¥ (71,947) ¥ 9,913 ¥ (4,101) ¥ (461,011)
Assets ¥11,716,316 ¥13,631,662 ¥1,131,400 ¥2,582,659 ¥29,062,037
Investment in equity method investees 1,606,013 168,057 — 36,036 1,810,106
Depreciation expense 1,072,848 389,937 32,385 — 1,495,170
Capital expenditure 1,343,572 883,968 35,334 62,023 2,324,897
101TOYOTA ANNUAL REPORT 2011