Toyota 2011 Annual Report Download - page 45
Download and view the complete annual report
Please find page 45 of the 2011 Toyota annual report below. You can navigate through the pages in the report by either clicking on the pages listed below, or by using the keyword search tool below to find specific information within the annual report.-
 1
1 -
2
-
3
-
4
-
5
-
6
-
7
-
8
-
9
-
10
-
11
-
12
-
13
-
14
-
15
-
16
-
17
-
18
-
19
-
20
-
21
-
22
-
23
-
24
-
25
-
26
-
27
-
28
-
29
-
30
-
31
-
32
-
33
-
34
-
 35
35 -
 36
36 -
 37
37 -
 38
38 -
 39
39 -
 40
40 -
 41
41 -
 42
42 -
 43
43 -
 44
44 -
 45
45 -
 46
46 -
 47
47 -
 48
48 -
 49
49 -
 50
50 -
 51
51 -
 52
52 -
 53
53 -
 54
54 -
 55
55 -
56
-
57
-
58
-
59
-
60
-
61
-
62
-
63
-
64
-
65
-
66
-
67
-
68
-
69
-
70
-
71
-
72
-
73
-
74
-
75
-
76
-
77
-
78
-
79
-
80
-
81
-
82
-
83
-
84
-
85
-
86
-
87
-
88
-
89
-
90
-
91
-
92
-
93
-
94
-
95
-
96
-
97
-
98
-
99
-
100
-
101
-
102
-
103
-
104
-
105
-
106
-
107
-
108
-
109
-
110
-
111
-
112
-
113
 |
 |
Overview
0822
Financial Section and
Investor Information
Business and
Performance Review
Special FeatureMessage/Vision
Management and
Corporate Information
Management's Discussion and Analysis of Financial Condition and Results of Operations
All financial information discussed in this section is derived from Toyota’s consolidated financial
statements that appear elsewhere in this annual report. The financial statements have been prepared
in conformity with accounting principles generally accepted in the United States of America.
The business segments of Toyota include automo-
tive operations, financial services operations and
all other operations. Automotive operations are
Toyota’s most significant business segment,
accounting for 89% of Toyota’s total revenues
before the elimination of intersegment revenues
for fiscal 2011. Toyota’s primary markets based
on vehicle unit sales for fiscal 2011 were: Japan
(26%), North America (28%), Europe (11%) and
Asia (17%). Japan’s economy suffered greatly
from the effects of the Great East Japan
Earthquake that occurred on March 11, 2011, and
its aftermath (collectively, the “Great East Japan
Earthquake”). Toyota experienced impacts on its
production in the latter half of March 2011. This
also had an effect on Toyota’s results of operations
in fiscal 2011, particularly in terms of damages on
several types of assets such as inventories and
an increase in provision for credit losses. The
following analysis describes these impacts. See
“Information on the Company — Business
Overview —” for more detailed information of the
based on location of customers for the past three
fiscal years.
During fiscal 2010, Toyota’s consolidated
vehicle unit sales in Japan increased as compared
with the prior fiscal year reflecting frequent
introduction of new products and sales efforts of
domestic dealers. During fiscal 2011, market
conditions in Japan deteriorated as compared
with the prior fiscal year. Despite this, Toyota and
Lexus brands’ market share in Japan excluding
mini-vehicles was 47.3%, and Toyota’s market
share (including Daihatsu and Hino brands) in
Japan including mini-vehicles was 43.7%, both
maintaining the high level of market share in
Japan from the prior fiscal year. Overseas consoli-
dated vehicle unit sales decreased during fiscal
2010, whereas they increased during fiscal 2011.
During fiscal 2010, total overseas vehicle unit
sales decreased, particularly in Europe, despite
an increase in Asia. During fiscal 2011, vehicle
unit sales increased in Asia and Other.
Toyota’s share of total vehicle unit sales in
each market is influenced by the quality, safety,
reliability, price, design, performance, economy
and utility of Toyota’s vehicles compared with
those offered by other manufacturers. The timely
introduction of new or redesigned vehicles is also
an important factor in satisfying customer needs.
Great East Japan Earthquake.
The worldwide automotive market is highly
competitive and volatile. The demand for automo-
biles is affected by a number of factors including
social, political and general economic conditions;
introduction of new vehicles and technologies;
and costs incurred by customers to purchase or
operate vehicles. These factors can cause
consumer demand to vary substantially in different
geographic markets and for different types of
automobiles.
During fiscal 2011, the automotive market
expanded especially in emerging countries such
as China, and technological development and
new product launches have accelerated, primarily
due to increased consumer demand for the
compact and low-price vehicles and heightened
worldwide environmental awareness.
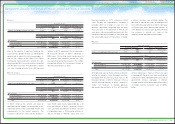
The following table sets forth Toyota’s consoli-
dated vehicle unit sales by geographic market
Toyota’s ability to satisfy changing customer
preferences can affect its revenues and earnings
significantly.
The profitability of Toyota’s automotive
operations is affected by many factors. These
factors include:
• vehicle unit sales volumes,
• the mix of vehicle models and options sold,
• the level of parts and service sales,
• the levels of price discounts and other sales
incentives and marketing costs,
• the cost of customer warranty claims and
other customer satisfaction actions,
• the cost of research and development and
other fixed costs,
• the prices of raw materials,
• the ability to control costs,
• the efficient use of production capacity,
• the adverse effect on production due to the
reliance on various suppliers for the
provision of supplies,
• the adverse effect on market, sales and
productions of natural calamities and
interruptions of social infrastructure, and
• changes in the value of the Japanese yen
and other currencies in which Toyota
conducts business.
Changes in laws, regulations, policies and
other governmental actions can also materially
impact the profitability of Toyota’s automotive
operations. These laws, regulations and policies
include those attributed to environmental matters,
vehicle safety, fuel economy and emissions that
can add significantly to the cost of vehicles. The
European Union has enforced a directive that
requires manufacturers to be financially respon-
sible for taking back end-of-life vehicles and to
take measures to ensure that adequate used
vehicle disposal facilities are established and
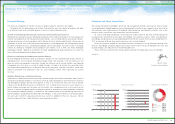
Automotive Market Environment
Thousands of units
Year Ended March 31,
2009 2010 2011
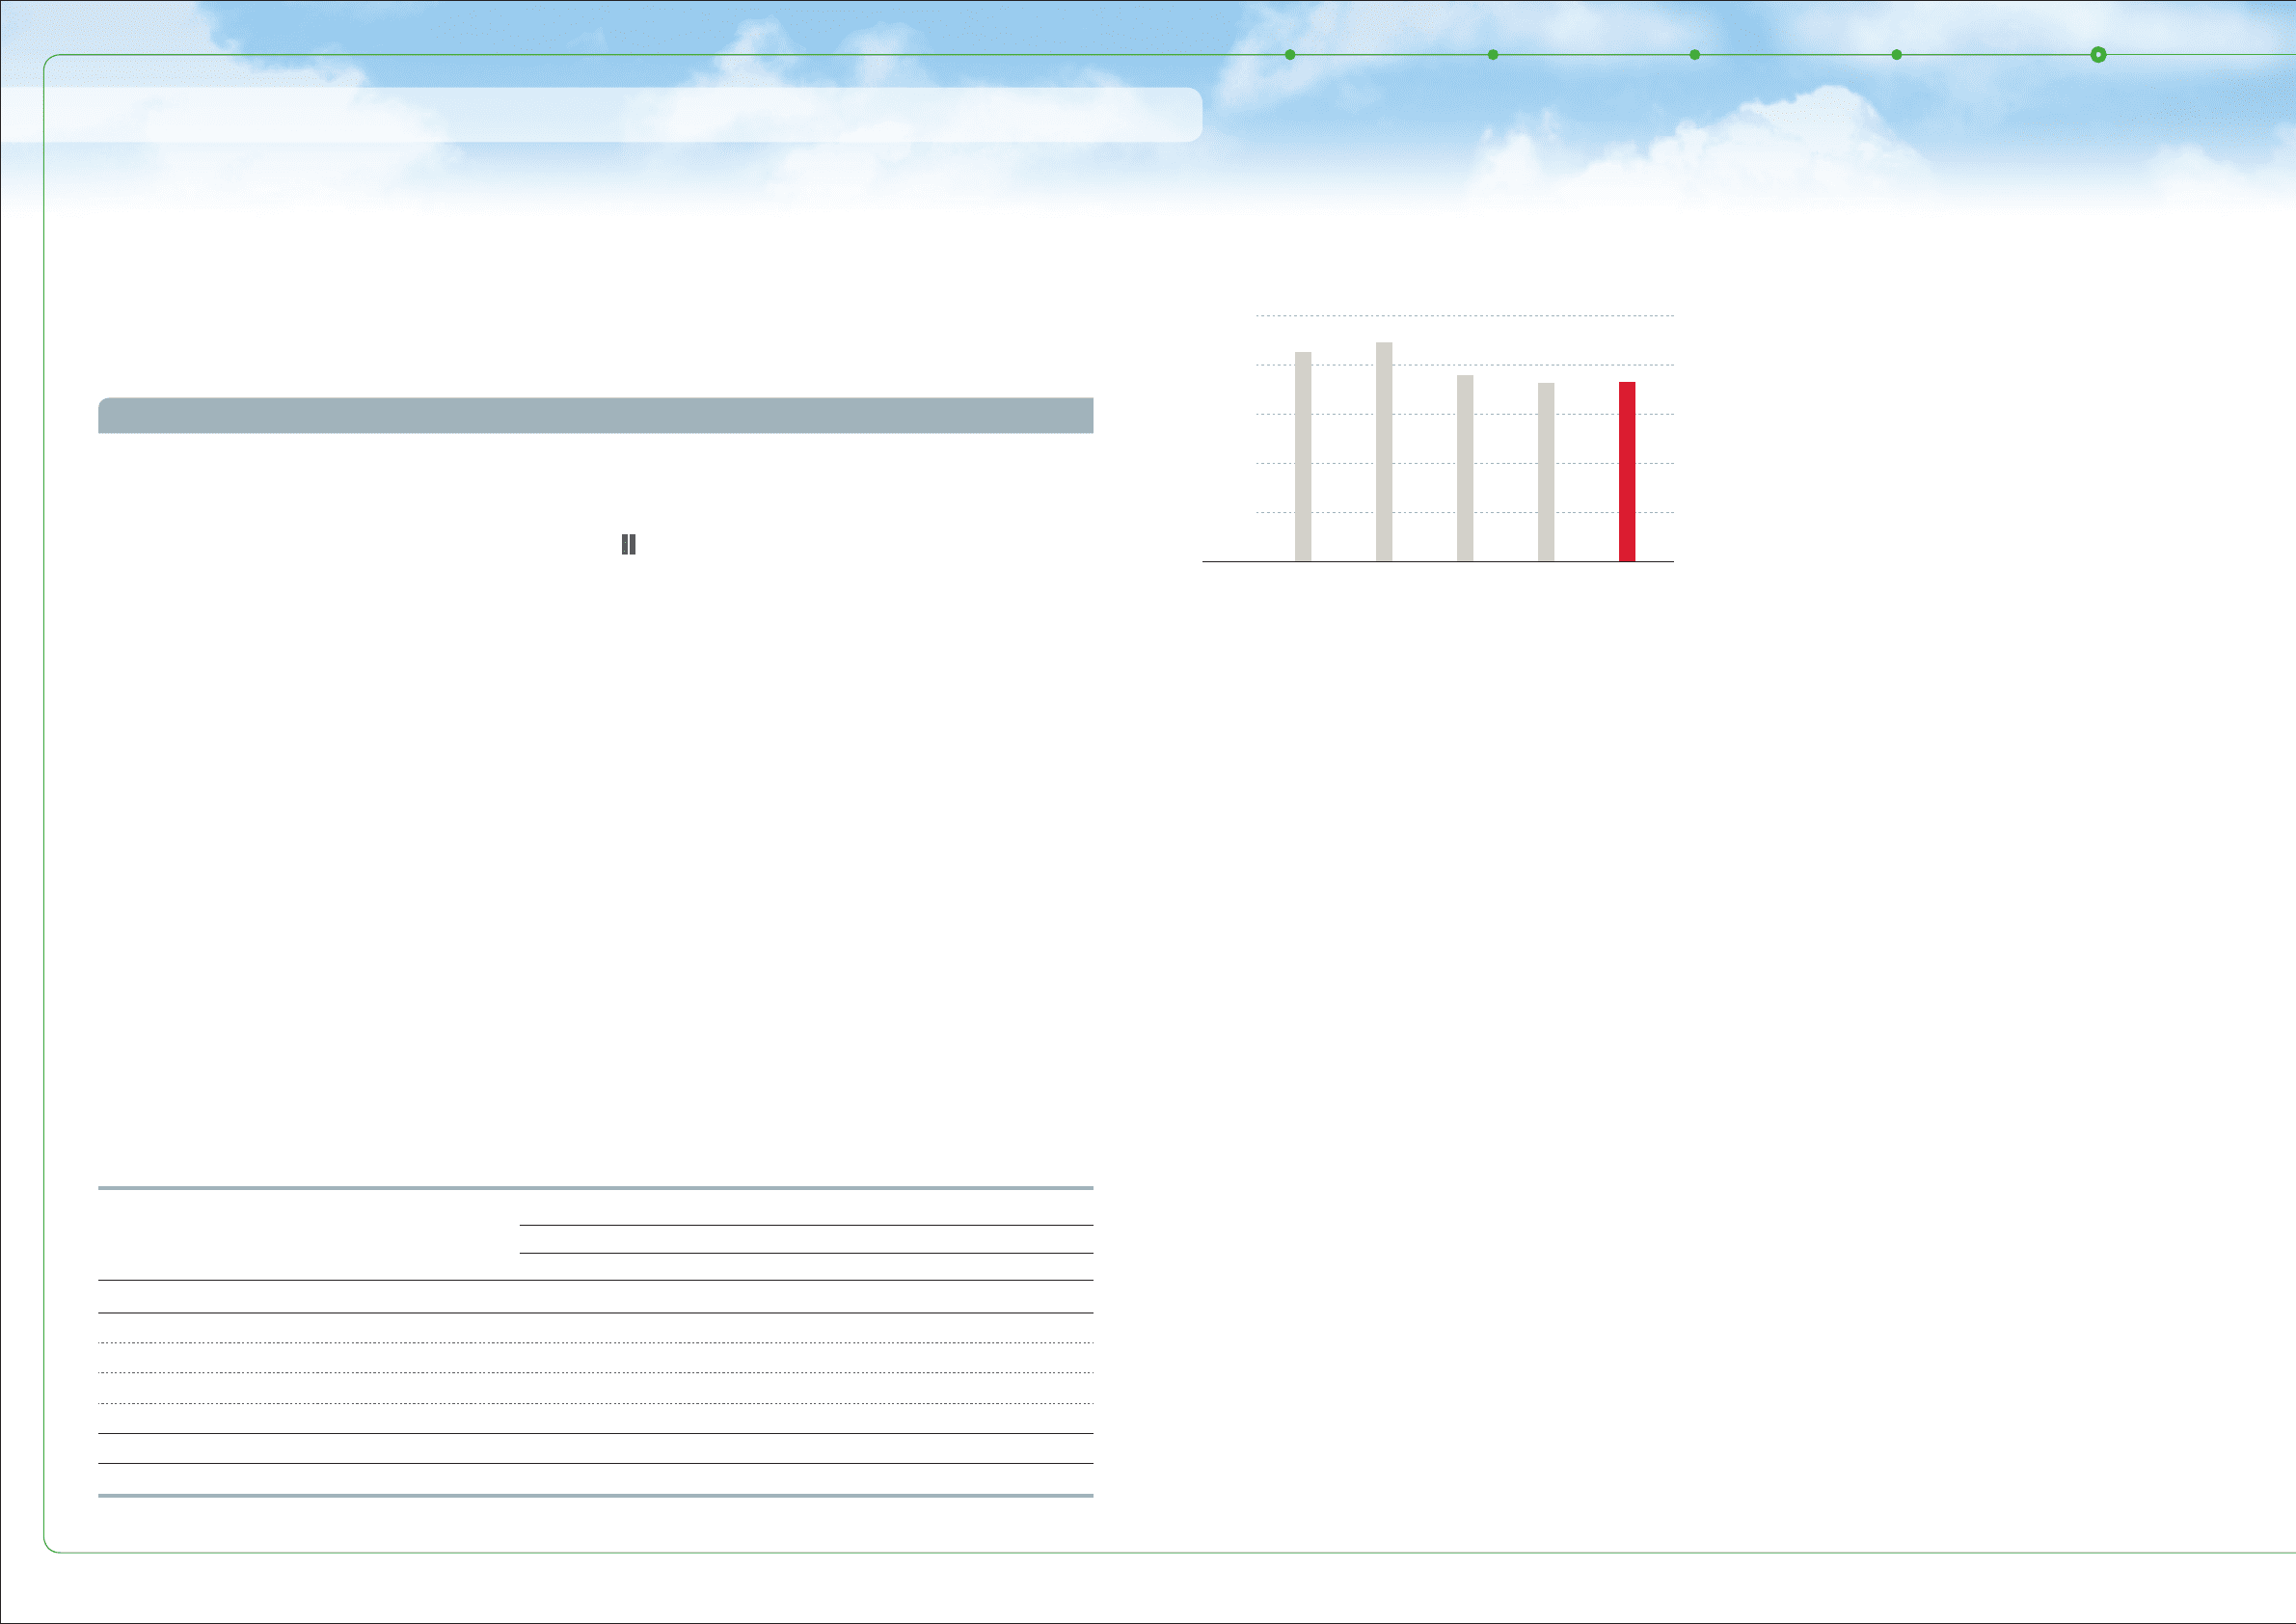
Japan 1,945 2,163 1,913
North America 2,212 2,098 2,031
Europe 1,062 858 796
Asia 905 979 1,255
Other* 1,443 1,139 1,313
Overseas total 5,622 5,074 5,395
Total 7,567 7,237 7,308
* “Other” consists of Central and South America, Oceania, Africa and the Middle East, etc.
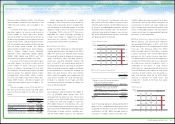
0
2,000
4,000
6,000
8,000
10,000
(Thousands of units)
FY ‘07 ‘11‘10‘09‘08
Consolidated Vehicle Sales
45TOYOTA ANNUAL REPORT 2011