Toyota 2011 Annual Report Download - page 19
Download and view the complete annual report
Please find page 19 of the 2011 Toyota annual report below. You can navigate through the pages in the report by either clicking on the pages listed below, or by using the keyword search tool below to find specific information within the annual report.-
 1
1 -
2
-
3
-
4
-
5
-
6
-
7
-
8
-
 9
9 -
 10
10 -
 11
11 -
 12
12 -
 13
13 -
 14
14 -
 15
15 -
 16
16 -
 17
17 -
 18
18 -
 19
19 -
 20
20 -
 21
21 -
 22
22 -
 23
23 -
 24
24 -
 25
25 -
 26
26 -
 27
27 -
 28
28 -
 29
29 -
30
-
31
-
32
-
33
-
34
-
35
-
36
-
37
-
38
-
39
-
40
-
41
-
42
-
43
-
44
-
45
-
46
-
47
-
48
-
49
-
50
-
51
-
52
-
53
-
54
-
55
-
56
-
57
-
58
-
59
-
60
-
61
-
62
-
63
-
64
-
65
-
66
-
67
-
68
-
69
-
70
-
71
-
72
-
73
-
74
-
75
-
76
-
77
-
78
-
79
-
80
-
81
-
82
-
83
-
84
-
85
-
86
-
87
-
88
-
89
-
90
-
91
-
92
-
93
-
94
-
95
-
96
-
97
-
98
-
99
-
100
-
101
-
102
-
103
-
104
-
105
-
106
-
107
-
108
-
109
-
110
-
111
-
112
-
113
 |
 |
Business and
Performance Review
Special Feature
Management and
Corporate Information
Financial Section and
Investor InformationMessage/Vision
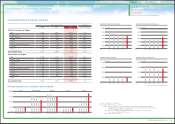
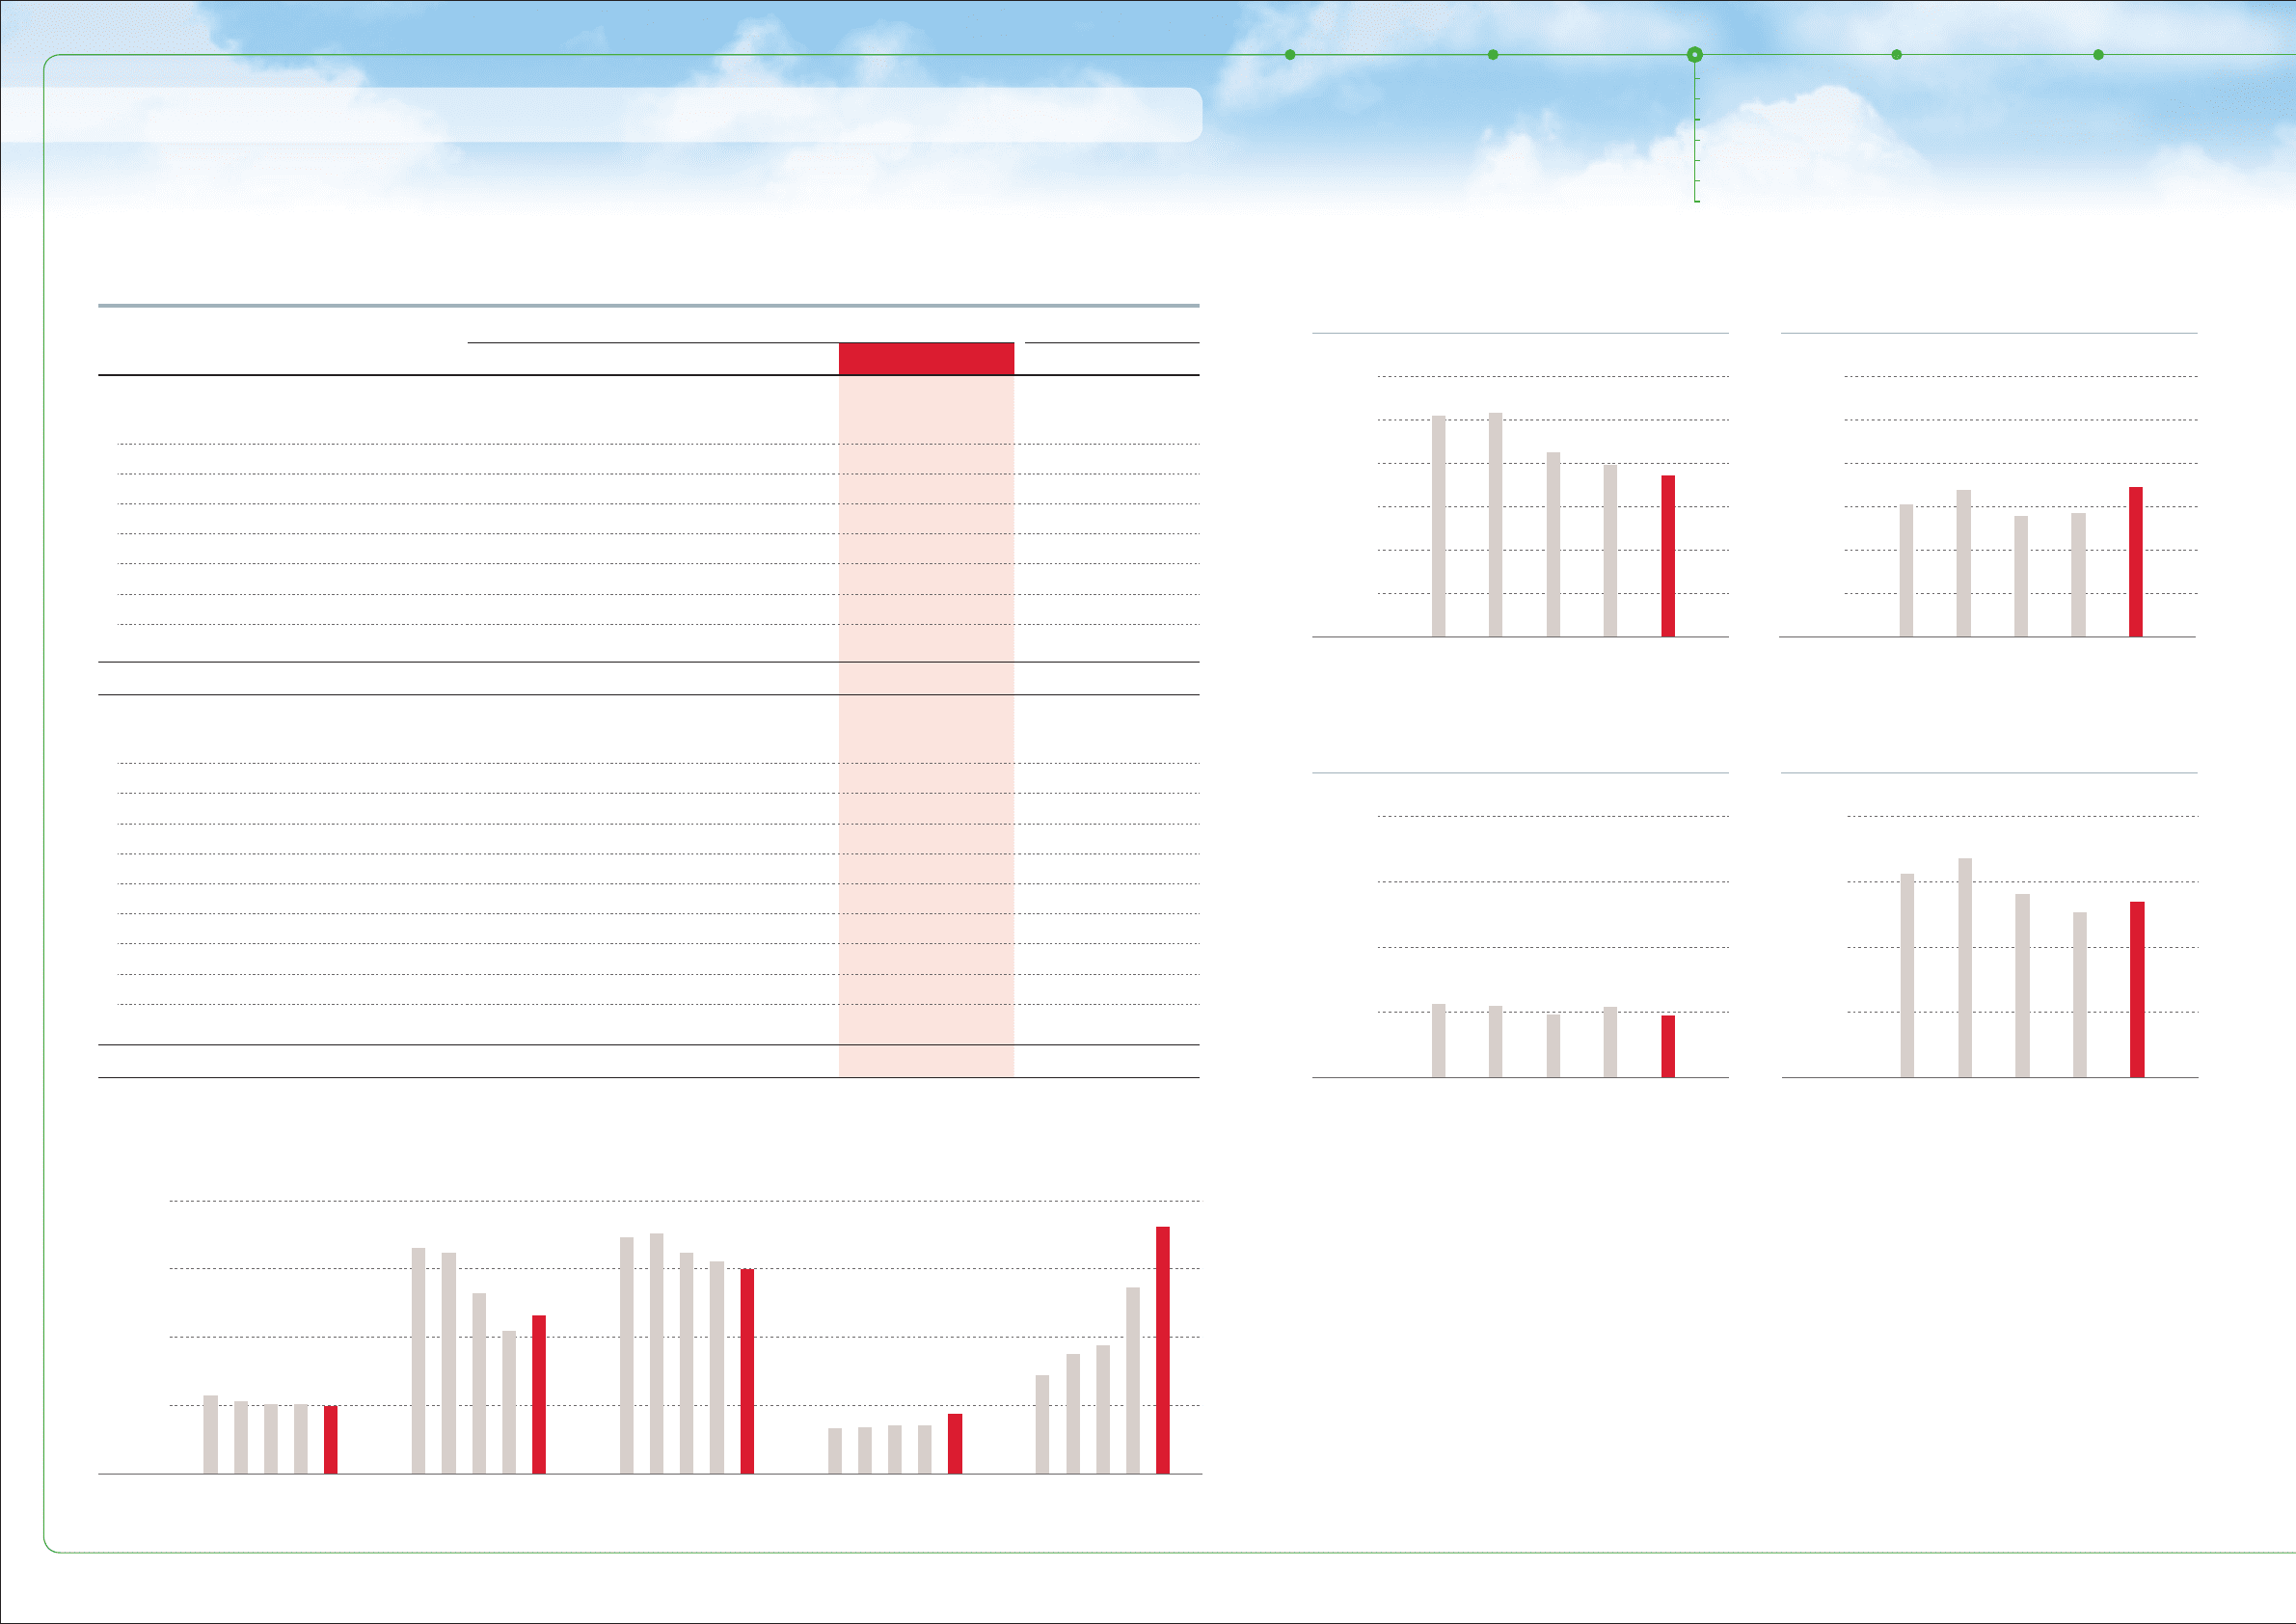
Thousands of units % change
2009 2010 2011 2011 vs. 2010
Vehicle Production by Region:
Japan 4,255 3,956 3,721 −6.0
Overseas Total 2,796 2,853 3,448 +20.9
North America 919 1,042 1,338 +28.5
Europe 482 433 372 −14.1
Asia 947 1,021 1,344 +31.6
Central and South America 151 146 148 +1.6
Oceania 130 106 113 +7.1
Africa 167 105 133 +26.7
Consolidated Total 7,051 6,809 7,169 +5.3
Vehicle Sales by Region:
Japan 1,945 2,163 1,913 −11.5
Overseas Total 5,622 5,074 5,395 +6.3
North America 2,212 2,098 2,031 −3.2
Europe 1,062 858 796 −7.3
Asia 905 979 1,255 +28.1
Central and South America 279 231 281 +21.9
Oceania 261 251 248 −1.2
Africa 289 184 209 +13.0
Middle East 606 466 569 +22.0
Other 8 7 6 −5.3
Consolidated Total 7,567 7,237 7,308 +1.0
Source: Toyota Motor Corporation
Note: Market definitions are as follows
Europe:
Asia:
Japan:
Germany, France, the United Kingdom, Italy, Spain, the Netherlands, Belgium,
Portugal, Denmark, Greece, Ireland, Sweden, Austria, Finland, Switzerland, Norway,
Poland, Hungary, and the Czech Republic
Indonesia, Thailand, the Philippines, Malaysia, Singapore, Vietnam, Taiwan,
South Korea and Brunei Darussalam
minivehicles included
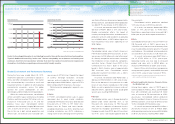
0
1,000
2,000
3,000
4,000
5,000
6,000
0
1,000
2,000
3,000
4,000
5,000
6,000
(Thousands of units)
FY
(Thousands of units)
FY
‘07 ‘11‘10‘09‘08 ‘07 ‘11‘10‘09‘08
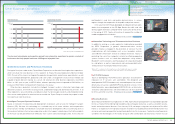
00
2,000
4,000
6,000
8,000
FY
2,000
4,000
6,000
8,000
‘07 ‘11‘10‘09‘08 ‘07 ‘11‘10‘09‘08
(Thousands of units)
FY
(Thousands of units)
Vehicle Production (Japan) Vehicle Production (Overseas)
Vehicle Sales (Japan) Vehicle Sales (Overseas)
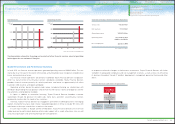
0
5,000
10,000
15,0 00
20,000
(Thousands of units)
CY ‘06 ‘10‘09‘08‘07 ‘0 6 ‘10‘09‘08‘07 ‘0 6 ‘10‘09‘08‘07 ‘06 ‘10‘09‘08‘07 ‘06 ‘10‘09‘08‘07
Japan United States Europe Asia China
Consolidated Performance Highlights
Consolidated Vehicle Production and Sales
Principal Market Data: Automotive Market (Sales) Note: Fiscal years ended March 31
Consolidated Performance Highlights
Automotive Operations
Restore and Renew Our Production Structure for Further Growth
Financial Services Operations
Other Business Operations
New Business Activities
Support for Recovery from the Great East Japan Earthquake
0822
19
TOYOTA ANNUAL REPORT 2011