Toyota 2011 Annual Report Download - page 64
Download and view the complete annual report
Please find page 64 of the 2011 Toyota annual report below. You can navigate through the pages in the report by either clicking on the pages listed below, or by using the keyword search tool below to find specific information within the annual report.-
 1
1 -
2
-
3
-
4
-
5
-
6
-
7
-
8
-
9
-
10
-
11
-
12
-
13
-
14
-
15
-
16
-
17
-
18
-
19
-
20
-
21
-
22
-
23
-
24
-
25
-
26
-
27
-
28
-
29
-
30
-
31
-
32
-
33
-
34
-
35
-
36
-
37
-
38
-
39
-
40
-
41
-
42
-
43
-
44
-
45
-
46
-
47
-
48
-
49
-
50
-
51
-
52
-
53
-
 54
54 -
 55
55 -
 56
56 -
 57
57 -
 58
58 -
 59
59 -
 60
60 -
 61
61 -
 62
62 -
 63
63 -
 64
64 -
 65
65 -
 66
66 -
 67
67 -
 68
68 -
 69
69 -
 70
70 -
 71
71 -
 72
72 -
 73
73 -
 74
74 -
75
-
76
-
77
-
78
-
79
-
80
-
81
-
82
-
83
-
84
-
85
-
86
-
87
-
88
-
89
-
90
-
91
-
92
-
93
-
94
-
95
-
96
-
97
-
98
-
99
-
100
-
101
-
102
-
103
-
104
-
105
-
106
-
107
-
108
-
109
-
110
-
111
-
112
-
113
 |
 |

0822
Financial Section and
Investor Information
Business and
Performance Review
Special FeatureMessage/Vision
Management and
Corporate Information
respect to Toyota’s obligations under current and
future environment regulations as described in
“Information on the Company — Business
Overview — Governmental Regulations, Environ-
mental and Safety Standards”.
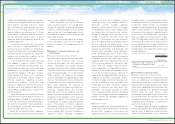
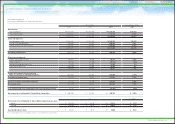
Cash and cash equivalents were ¥2,080.7
billion as of March 31, 2011. Most of Toyota’s cash
and cash equivalents are held in Japanese yen
and in U.S. dollars. In addition, time deposits
were ¥203.9 billion and marketable securities
were ¥1,225.4 billion as of March 31, 2011.
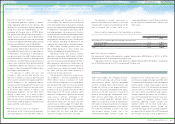
Liquid assets, which Toyota defines as cash
and cash equivalents, time deposits, marketable
debt securities and its investment in monetary
trust funds, increased during fiscal 2011 by
¥665.0 billion, or 12.6%, to ¥5,963.2 billion.
Trade accounts and notes receivable, less
allowance for doubtful accounts decreased
during fiscal 2011 by ¥437.0 billion, or 23.2%, to
¥1,449.2 billion. This decrease was due to the
decrease in the volume of sales in the second
half of fiscal 2011.
Inventories decreased during fiscal 2011 by
¥118.1 billion, or 8.3%, to ¥1,304.2 billion.
Total finance receivables, net decreased
during fiscal 2011 by ¥146.6 billion, or 1.5%, to
¥9,693.5 billion. The decrease in finance
receivables, net is due to fluctuations in foreign
currency translation rates. As of March 31, 2011,
finance receivables were geographically
distributed as follows: in North America 59.0%, in
Japan 12.7%, in Europe 10.4%, in Asia 5.8% and
in Other 12.1%.
Marketable securities and other securities
investments, including those included in current
assets, increased during fiscal 2011 by ¥747.1
billion, or 18.5%, reflecting purchase of marketable
securities and security investments, and an
increase in the fair values of common stocks.
Property, plant and equipment decreased
during fiscal 2011 by ¥401.8 billion, or 6.0%,
primarily reflecting the impacts of depreciation
charges during the year and fluctuations in foreign
currency translation rates, partially offset by the
capital expenditures.
Accounts and notes payable decreased
during fiscal 2011 by ¥453.4 billion, or 23.2%. This
decrease was due to the decrease in production
volume in the second half of fiscal 2011.
Management's Discussion and Analysis of Financial Condition and Results of Operations
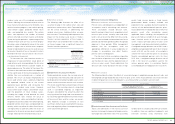
0
2,000
1,000
3,000
4,000
6,000
5,000
‘07 ‘11‘10‘09‘08
FY
(¥ Billion)
Liquid Assets*
* Cash and cash equivalents, time deposits, marketable debt
securities and investment in monetary trust funds
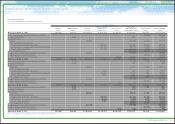
6,000
3,000
9,000
12,000
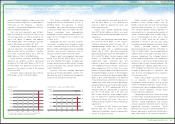
15,000 100
80
60
40
20
‘07 ‘11‘10‘09‘08
0 0
FY
Equity ratio
(Right scale)
(¥ Billion)
(%)
Shareholders’ Equity and Equity Ratio
Accrued expenses increased during fiscal
2011 by ¥37.4 billion, or 2.1%, reflecting the
increase in expenses related to the recalls and
other safety measures.
Income taxes payable decreased during
fiscal 2011 by ¥40.6 billion, or 26.5%, as a result
of a decrease of income taxes payable at overseas
subsidiaries.
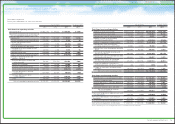
Toyota’s total borrowings decreased during
fiscal 2011 by ¥112.4 billion, or 0.9%. Toyota’s
short-term borrowings consist of loans with a
weighted-average interest rate of 1.57% and
commercial paper with a weighted-average
interest rate of 0.67%. Short-term borrowings
decreased during fiscal 2011 by ¥100.6 billion, or
3.1%, to ¥3,179.0 billion. Toyota’s long-term debt
consists of unsecured and secured loans,
medium-term notes, unsecured notes and
long-term capital lease obligations with interest
rates ranging from 0.00% to 29.00%, and maturity
dates ranging from 2011 to 2050. The current
portion of long-term debt increased during fiscal
2011 by ¥554.5 billion, or 25.0%, to ¥2,772.8 billion
and the non-current portion decreased by ¥566.2
billion, or 8.1%, to ¥6,449.2 billion. The decrease
in total borrowings resulted from the decrease in
medium-term notes and short-term borrowings,
partially offset by increase in long-term borrowings.
As of March 31, 2011, approximately 31% of
long-term debt was denominated in Japanese
yen, 24% in U.S. dollars, 12% in the euros and
33% in other currencies. Toyota hedges interest
rate risk exposure of fixed-rate borrowings by
entering into interest rate swaps. There are no
material seasonal variations in Toyota’s borrowings
requirements.
As of March 31, 2011, Toyota’s total interest
bearing debt was 120.0% of Toyota Motor
Corporation shareholders’ equity, compared with
120.8% as of March 31, 2010.
Toyota’s long-term debt is rated “AA-” by
Standard & Poor’s Ratings Group, “Aa2” by
Moody’s Investors Services and “AAA” by Rating
and Investment Information, Inc., as of May 31,
2011. However, Moody’s Investors Services has
announced that it is considering the reduction of
Toyota’s long-term debt rating. A credit rating is
not a recommendation to buy, sell or hold
securities. A credit rating may be subject to
withdrawal or revision at any time. Each rating
should be evaluated separately of any other rating.
Toyota’s unfunded pension liabilities
decreased during fiscal 2011 by ¥1.9 billion, or
0.3%, to ¥545.7 billion. The unfunded pension
liabilities relate to the parent company and its
overseas subsidiaries. The unfunded amounts
will be funded through future cash contributions
by Toyota or in some cases will be settled on the
retirement date of each covered employee. The
unfunded pension liabilities decreased in fiscal
2011 compared with the prior fiscal year due to
changes of pension plans in subsidiaries. See
note 19 to the consolidated financial statements
for further discussion.
Toyota’s treasury policy is to maintain controls
on all exposures, to adhere to stringent
counterparty credit standards, and to actively
monitor marketplace exposures. Toyota remains
centralized, and is pursuing global efficiency of its
financial services operations through Toyota
Financial Services Corporation.
The key element of Toyota’s financial strategy
is maintaining a strong financial position that will
allow Toyota to fund its research and development
initiatives, capital expenditures and financial
services operations efficiently even if earnings
experience short-term fluctuations. Toyota
believes that it maintains sufficient liquidity for its
present requirements and that by maintaining its
high credit ratings, it will continue to be able to
64
TOYOTA ANNUAL REPORT 2011