Toyota 2011 Annual Report Download - page 94
Download and view the complete annual report
Please find page 94 of the 2011 Toyota annual report below. You can navigate through the pages in the report by either clicking on the pages listed below, or by using the keyword search tool below to find specific information within the annual report.-
 1
1 -
2
-
3
-
4
-
5
-
6
-
7
-
8
-
9
-
10
-
11
-
12
-
13
-
14
-
15
-
16
-
17
-
18
-
19
-
20
-
21
-
22
-
23
-
24
-
25
-
26
-
27
-
28
-
29
-
30
-
31
-
32
-
33
-
34
-
35
-
36
-
37
-
38
-
39
-
40
-
41
-
42
-
43
-
44
-
45
-
46
-
47
-
48
-
49
-
50
-
51
-
52
-
53
-
54
-
55
-
56
-
57
-
58
-
59
-
60
-
61
-
62
-
63
-
64
-
65
-
66
-
67
-
68
-
69
-
70
-
71
-
72
-
73
-
74
-
75
-
76
-
77
-
78
-
79
-
80
-
81
-
82
-
83
-
 84
84 -
 85
85 -
 86
86 -
 87
87 -
 88
88 -
 89
89 -
 90
90 -
 91
91 -
 92
92 -
 93
93 -
 94
94 -
 95
95 -
 96
96 -
 97
97 -
 98
98 -
 99
99 -
 100
100 -
 101
101 -
 102
102 -
 103
103 -
 104
104 -
105
-
106
-
107
-
108
-
109
-
110
-
111
-
112
-
113
 |
 |

0822
Financial Section and
Investor Information
Business and
Performance Review
Special FeatureMessage/Vision
Management and
Corporate Information
Notes to Consolidated Financial Statements
The expected rate of return on plan assets is
determined after considering several applicable
factors including, the composition of plan assets
held, assumed risks of asset management,
historical results of the returns on plan assets,
Toyota’s principal policy for plan asset manage-
ment, and forecasted market conditions.
Toyota’s policy and objective for plan asset
management is to maximize returns on plan assets
to meet future benefit payment requirements
under risks which Toyota considers permissible.
Asset allocations under the plan asset manage-
ment are determined based on plan asset
management policies of each plan which are
established to achieve the optimized asset
compositions in terms of the long-term overall plan
asset management. Excepting equity securities
contributed by Toyota, approximately 50% of the
plan assets is invested in equity securities,
The following is description of the assets,
information about the valuation techniques used
to measure fair value, key inputs and significant
assumptions:
Quoted market prices for identical securities
are used to measure fair value of common stocks.
Common stocks include 64% of Japanese stocks
and 36% of foreign stocks as of March 31, 2010,
and 51% of Japanese stocks and 49% of foreign
stocks as of March 31, 2011.
Quoted market prices for identical securities
are used to measure fair value of government
bonds. Government bonds include 25% of
Japanese government bonds and 75% of foreign
government bonds as of March 31, 2010, and
25% of Japanese government bonds and 75% of
foreign government bonds as of March 31, 2011.
approximately 30% is invested in debt securities,
and the rest of them is invested in insurance
contracts and other products. When actual alloca-
tions are not in line with target allocations, Toyota
rebalances its investments in accordance with the
policies. Prior to making individual investments,
Toyota performs in-depth assessments of
corresponding factors including category of
products, industry type, currencies and liquidity of
each potential investment under consideration to
mitigate concentrations of risks such as market
risk and foreign currency exchange rate risk. To
assess performance of the investments, Toyota
establishes bench mark return rates for each
individual investment, combines these individual
bench mark rates based on the asset composition
ratios within each asset category, and compares
the combined rates with the corresponding actual
return rates on each asset category.
Commingled funds are beneficial interests of
collective trust, which are mainly invested by the
parent company and Japanese subsidiaries. The
fair values of commingled funds are measured
using the net asset value (“NAV”) provided by the
administrator of the fund, and are categorized by
the ability to redeem investments at the measure-
ment day.
The fair values of insurance contracts are
measured using contracted amount with accrued
interest.
Other consists of cash equivalents, other
private placement investment funds and other
assets. The fair values of other private placement
investment funds are measured using the NAV
provided by the administrator of the fund, and are
categorized by the ability to redeem investments
at the measurement day.
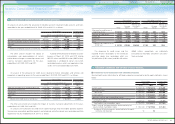
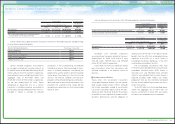
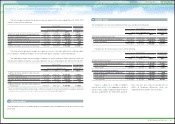
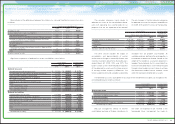
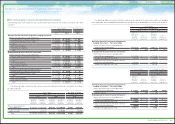
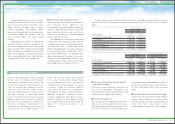
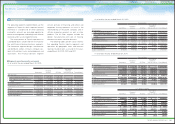
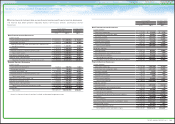
The following table summarizes the fair value of classes of plan assets as of March 31, 2010 and
2011. See note 26 to the consolidated financial statements for three levels of input which are used to
measure fair value.
Yen in millions
March 31, 2010
Level 1 Level 2 Level 3 Total
Equity securities
Common stocks ¥471,262 ¥ — ¥ — ¥ 471,262
Commingled funds — 237,495 — 237,495
471,262 237,495 — 708,757
Debt securities
Government bonds 79,739 — — 79,739
Commingled funds — 147,345 2,663 150,008
Other 39,231 19,561 928 59,720
118,970 166,906 3,591 289,467
Insurance contracts — 97,086 — 97,086
Other 35,774 1,449 46,518 83,741
Total ¥626,006 ¥502,936 ¥50,109 ¥1,179,051
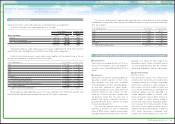
Yen in millions U.S. dollars in millions
March 31, 2011 March 31, 2011
Level 1 Level 2 Level 3 Total Level 1 Level 2 Level 3 Total
Equity securities
Common stocks ¥489,759 ¥ ―¥ ―¥ 489,759 $5,890 $ — $ — $ 5,890
Commingled funds ―180,901 ―180,901 — 2,176 — 2,176
489,759 180,901 ―670,660 5,890 2,176 — 8,066
Debt securities
Government bonds 82,685 ― ― 82,685 995 — — 995
Commingled funds ―159,232 ―159,232 — 1,915 — 1,915
Other 29,217 44,994 746 74,957 351 541 9 901
111,902 204,226 746 316,874 1,346 2,456 9 3,811
Insurance contracts ―90,972 ―90,972 — 1,094 — 1,094
Other 19,610 26,418 58,851 104,879 236 317 708 1,261
Total ¥621,271 ¥502,517 ¥59,597 ¥1,183,385 $7,472 $6,043 $717 $14,232
94
TOYOTA ANNUAL REPORT 2011