Toyota 2011 Annual Report Download - page 97
Download and view the complete annual report
Please find page 97 of the 2011 Toyota annual report below. You can navigate through the pages in the report by either clicking on the pages listed below, or by using the keyword search tool below to find specific information within the annual report.-
 1
1 -
2
-
3
-
4
-
5
-
6
-
7
-
8
-
9
-
10
-
11
-
12
-
13
-
14
-
15
-
16
-
17
-
18
-
19
-
20
-
21
-
22
-
23
-
24
-
25
-
26
-
27
-
28
-
29
-
30
-
31
-
32
-
33
-
34
-
35
-
36
-
37
-
38
-
39
-
40
-
41
-
42
-
43
-
44
-
45
-
46
-
47
-
48
-
49
-
50
-
51
-
52
-
53
-
54
-
55
-
56
-
57
-
58
-
59
-
60
-
61
-
62
-
63
-
64
-
65
-
66
-
67
-
68
-
69
-
70
-
71
-
72
-
73
-
74
-
75
-
76
-
77
-
78
-
79
-
80
-
81
-
82
-
83
-
84
-
85
-
86
-
 87
87 -
 88
88 -
 89
89 -
 90
90 -
 91
91 -
 92
92 -
 93
93 -
 94
94 -
 95
95 -
 96
96 -
 97
97 -
 98
98 -
 99
99 -
 100
100 -
 101
101 -
 102
102 -
 103
103 -
 104
104 -
 105
105 -
 106
106 -
 107
107 -
108
-
109
-
110
-
111
-
112
-
113
 |
 |

Other financial instruments:
21
0822
Financial Section and
Investor Information
Business and
Performance Review
Special FeatureMessage/Vision
Management and
Corporate Information
Notes to Consolidated Financial Statements
Undesignated derivative financial instruments
are used to manage risks of fluctuations in interest
rates to certain borrowing transactions and in
foreign currency exchange rates of certain
currency receivables and payables. Toyota
accounts for these derivative financial instruments
as economic hedges with changes in the fair
value recorded directly into current period
earnings.
Unrealized gains or (losses) on undesignated
derivative financial instruments reported in the
cost of financing operations for the years ended
March 31, 2009, 2010 and 2011 were ¥(80,298)
million, ¥71,538 million and ¥93,370 million ($1,123
million) those reported in foreign exchange gain
(loss), net were ¥(33,578) million, ¥(26,476) million
and ¥(240) million ($(3) million), respectively.
Toyota enters into International Swaps and Deriva-
tives Association Master Agreements with
counterparties. These Master Agreements contain
a provision requiring either Toyota or the counter-
party to settle the contract or to post assets to the
other party in the event of a ratings downgrade
below a specified threshold.
The aggregate fair value amount of derivative
financial instruments that contain credit risk related
contingent features that are in a net liability position
as of March 31, 2011 is ¥27,432 million ($330
million). The aggregate fair value amount of assets
that are already posted as of March 31, 2011 is
¥5,773 million ($69 million). If the ratings of Toyota
decline below specified thresholds, the maximum
amount of assets to be posted or for which Toyota
could be required to settle the contracts is ¥27,432
million ($330 million) as of March 31, 2011.
Credit risk related contingent features
Toyota has certain financial instruments, including
financial assets and liabilities and off-balance
sheet financial instruments which arose in the
normal course of business. These financial instru-
ments are executed with creditworthy financial
institutions, and virtually all foreign currency
contracts are denominated in U.S. dollars, euros
and other currencies of major industrialized
countries. Financial instruments involve, to varying
degrees, market risk as instruments are subject to
price fluctuations, and elements of credit risk in
the event a counterparty should default. In the
unlikely event the counterparties fail to meet the
contractual terms of a foreign currency or an
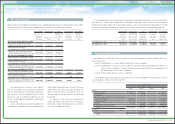
In the normal course of business, substantially all
cash and cash equivalents, time deposits and
other receivables are highly liquid and are carried
at amounts which approximate fair value.
The carrying value of variable rate finance receiv-
ables was assumed to approximate fair value as
they were repriced at prevailing market rates. The
fair value of fixed rate finance receivables was
interest rate instrument, Toyota’s risk is limited to
the fair value of the instrument. Although Toyota
may be exposed to losses in the event of
non-performance by counterparties on financial
instruments, it does not anticipate significant
losses due to the nature of its counterparties.
Counterparties to Toyota’s financial instruments
represent, in general, international financial
institutions. Additionally, Toyota does not have a
significant exposure to any individual counter-
party. Toyota believes that the overall credit risk
related to its financial instruments is not
significant.
estimated by discounting expected cash flows to
present value using the rates at which new loans
of similar credit quality and maturity would be
made.
The fair values of short-term borrowings and total
long-term debt including the current portion were
estimated based on the discounted amounts of
future cash flows using Toyota’s current
incremental borrowing rates for similar liabilities.
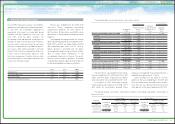
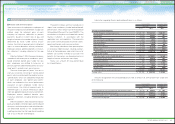
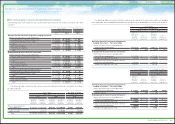
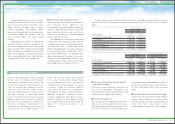
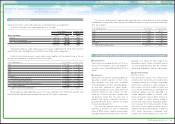
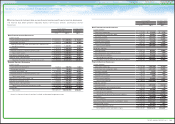
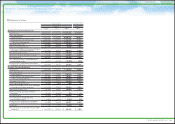
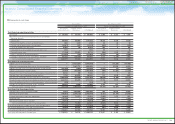
The estimated fair values of Toyota’s financial instruments, excluding marketable securities and other
securities investments and affiliated companies and derivative financial instruments, are summarized as
follows:
Yen in millions U.S. dollars in millions
March 31, 2011 March 31, 2011
Asset (Liability)
Carrying
amount
Estimated fair
value
Carrying
amount
Estimated fair
value
Cash and cash equivalents ¥ 2,080,709 ¥ 2,080,709 $ 25,024 $ 25,024
Time deposits 203,874 203,874 2,452 2,452
Total finance receivables, net 8,680,882 8,971,523 104,400 107,896
Other receivables 306,201 306,201 3,682 3,682
Short-term borrowings (3,179,009) (3,179,009) (38,232) (38,232)
Long-term debt including the current portion (9,200,130) (9,274,881) (110,645) (111,544)
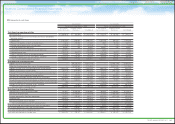
Yen in millions
March 31, 2010
Asset (Liability)
Carrying
amount
Estimated fair
value
Cash and cash equivalents ¥ 1,865,746 ¥ 1,865,746
Time deposits 392,724 392,724
Total finance receivables, net 8,759,826 9,112,527
Other receivables 360,379 360,379
Short-term borrowings (3,279,673) (3,279,673)
Long-term debt including the current portion (9,191,490) (9,297,904)
Cash and cash equivalents, time deposits
and other receivables
Finance receivables, net
Short-term borrowings and long-term debt
97TOYOTA ANNUAL REPORT 2011