Toyota 2011 Annual Report Download - page 56
Download and view the complete annual report
Please find page 56 of the 2011 Toyota annual report below. You can navigate through the pages in the report by either clicking on the pages listed below, or by using the keyword search tool below to find specific information within the annual report.-
 1
1 -
2
-
3
-
4
-
5
-
6
-
7
-
8
-
9
-
10
-
11
-
12
-
13
-
14
-
15
-
16
-
17
-
18
-
19
-
20
-
21
-
22
-
23
-
24
-
25
-
26
-
27
-
28
-
29
-
30
-
31
-
32
-
33
-
34
-
35
-
36
-
37
-
38
-
39
-
40
-
41
-
42
-
43
-
44
-
45
-
 46
46 -
 47
47 -
 48
48 -
 49
49 -
 50
50 -
 51
51 -
 52
52 -
 53
53 -
 54
54 -
 55
55 -
 56
56 -
 57
57 -
 58
58 -
 59
59 -
 60
60 -
 61
61 -
 62
62 -
 63
63 -
 64
64 -
 65
65 -
 66
66 -
67
-
68
-
69
-
70
-
71
-
72
-
73
-
74
-
75
-
76
-
77
-
78
-
79
-
80
-
81
-
82
-
83
-
84
-
85
-
86
-
87
-
88
-
89
-
90
-
91
-
92
-
93
-
94
-
95
-
96
-
97
-
98
-
99
-
100
-
101
-
102
-
103
-
104
-
105
-
106
-
107
-
108
-
109
-
110
-
111
-
112
-
113
 |
 |

0822
Financial Section and
Investor Information
Business and
Performance Review
Special FeatureMessage/Vision
Management and
Corporate Information
Management's Discussion and Analysis of Financial Condition and Results of Operations
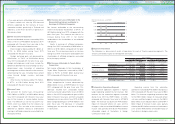
Number of financing contracts in thousands
Year ended March 31, 2010 vs. 2009 Change
2009 2010 Amount Percentage
Japan 1,660 1,684 24 +1.4%
North America 4,403 4,488 85 +1.9%
Europe 748 774 26 +3.5%
Asia 387 428 41 +10.6%
Other* 440 476 36 +8.2%
Total 7,638 7,850 212 +2.8%
* “Other” consists of Central and South America, Oceania and Africa.
Geographically, net revenues (before the
elimination of intersegment revenues) for fiscal
2010 decreased by 7.9% in Japan, 8.9% in North
America, 28.7% in Europe, 2.4% in Asia and
11.1% in Other compared with the prior fiscal year.
Excluding the difference in the Japanese yen
value used for translation purposes of ¥1,020.2
billion, net revenues in fiscal 2010 would have
decreased by 7.9% in Japan, 1.2% in North
America, 20.1% in Europe, 7.3% in Other and
would have increased by 5.5% in Asia compared
with the prior fiscal year.
The following is a discussion of net revenues
in each geographic market (before the elimination
of intersegment revenues).
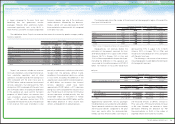
Thousands of units
Year ended March 31, 2010 vs. 2009 Change
2009 2010 Amount Percentage
Toyota’s consolidated vehicle unit sales 1,945 2,163 218 +11.2%
Yen in millions
Year ended March 31, 2010 vs. 2009 Change
2009 2010 Amount Percentage
Net revenues:
Sales of products ¥12,067,494 ¥11,095,044 ¥(972,450) −8.1%
Financial services 119,243 125,259 6,016 +5.0%
Total ¥12,186,737 ¥11,220,303 ¥(966,434) −7.9%
Japan
Supported by government stimulus packages
including the eco-car tax reduction and subsidies,
Toyota’s domestic vehicle unit sales increased by
218 thousand vehicles compared to the prior
fiscal year mainly within the environmentally-
friendly and new vehicle markets, consisting of a
210 thousand vehicles, or 297.6%, increase in
Prius sales and a 19 thousand vehicles increase
in SAI sales. However, net revenues in Japan
decreased reflecting the decrease by 497
thousand vehicles, or 18.4%, in the number of
exported vehicles for the overseas markets.
in Japan compared to the prior fiscal year
benefiting from the government stimulus
packages. However, other automotive markets
contracted significantly such as by 22.0% in
North America and 13.7% in Europe compared to
Toyota’s net revenues include net revenues
from sales of products, consisting of net revenues
from automotive operations and all other
operations, that decreased by 7.6% during fiscal
2010 compared with the prior fiscal year to
¥17,724.7 billion, and net revenues from financial
services operations that decreased by 9.6%
during fiscal 2010 compared with the prior fiscal
year to ¥1,226.2 billion. Excluding the difference
in the Japanese yen value used for translation
purposes of ¥894.0 billion, net revenues from
sales of products would have been ¥18,618.7
billion, a 2.9% decrease during fiscal 2010
compared with the prior fiscal year. The decrease
in net revenues from sales of products is due
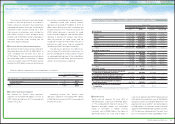
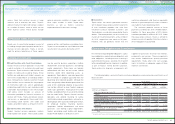
The table below shows Toyota’s net revenues from external customers by product category and by
business segment.
the prior calendar year due to the continuous
market downturn. Affected by this downturn,
Toyota’s vehicle unit sales decreased to 7,237
thousand vehicles, a decrease of 4.4%, compared
to the prior fiscal year.
The following table shows the number of financing contracts by geographic region at the end of the
fiscal year 2009 and 2010.
primarily to a decrease in vehicle unit sales which
resulted from the generally difficult market
conditions in the automotive industry as a whole
in fiscal 2010. Excluding the difference in the
Japanese yen value used for translation purposes
of ¥92.9 billion, net revenues from financial
services operations would have been
approximately ¥1,319.1 billion, a 2.7% decrease
during fiscal 2010 compared with the prior fiscal
year. The decrease in net revenues from financial
services operations resulted primarily from the
unfavorable impact of fluctuations in foreign
currency translation rates of ¥92.9 billion and the
¥63.5 billion decrease in rental income from
vehicles and equipment on operating leases.
Yen in millions
Year ended March 31, 2010 vs. 2009 Change
2009 2010 Amount Percentage
Vehicles ¥15,635,490 ¥14,309,595 ¥(1,325,895) −8.5%
Parts and components for overseas production 298,176 355,273 57,097 +19.1%
Parts and components for after service 1,575,316 1,543,941 (31,375) −2.0%
Other 1,041,519 978,499 (63,020) −6.1%
Total Automotive 18,550,501 17,187,308 (1,363,193) −7.3%
All Other 623,219 537,421 (85,798) −13.8%
Total sales of products 19,173,720 17,724,729 (1,448,991) −7.6%
Financial services 1,355,850 1,226,244 (129,606) −9.6%
Total ¥20,529,570 ¥18,950,973 ¥(1,578,597) −7.7%
56
TOYOTA ANNUAL REPORT 2011