Toyota 2011 Annual Report Download - page 102
Download and view the complete annual report
Please find page 102 of the 2011 Toyota annual report below. You can navigate through the pages in the report by either clicking on the pages listed below, or by using the keyword search tool below to find specific information within the annual report.-
 1
1 -
2
-
3
-
4
-
5
-
6
-
7
-
8
-
9
-
10
-
11
-
12
-
13
-
14
-
15
-
16
-
17
-
18
-
19
-
20
-
21
-
22
-
23
-
24
-
25
-
26
-
27
-
28
-
29
-
30
-
31
-
32
-
33
-
34
-
35
-
36
-
37
-
38
-
39
-
40
-
41
-
42
-
43
-
44
-
45
-
46
-
47
-
48
-
49
-
50
-
51
-
52
-
53
-
54
-
55
-
56
-
57
-
58
-
59
-
60
-
61
-
62
-
63
-
64
-
65
-
66
-
67
-
68
-
69
-
70
-
71
-
72
-
73
-
74
-
75
-
76
-
77
-
78
-
79
-
80
-
81
-
82
-
83
-
84
-
85
-
86
-
87
-
88
-
89
-
90
-
91
-
 92
92 -
 93
93 -
 94
94 -
 95
95 -
 96
96 -
 97
97 -
 98
98 -
 99
99 -
 100
100 -
 101
101 -
 102
102 -
 103
103 -
 104
104 -
 105
105 -
 106
106 -
 107
107 -
 108
108 -
 109
109 -
 110
110 -
 111
111 -
 112
112 -
113
 |
 |

0822
Financial Section and
Investor Information
Business and
Performance Review
Special FeatureMessage/Vision
Management and
Corporate Information
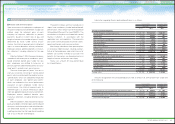
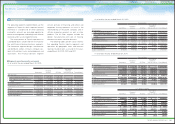
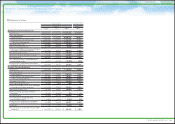
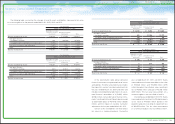
Notes to Consolidated Financial Statements
Geographic Information
Overseas Revenues by destination
As of and for the year ended March 31, 2009:
Yen in millions
Japan
North
America Europe Asia Other
Inter-segment
Elimination/
Unallocated
Amount Consolidated
Net revenues
Sales to external customers
¥ 7,471,916 ¥ 6,097,676 ¥2,889,753 ¥2,450,412 ¥1,619,813 ¥ — ¥20,529,570
Inter-segment sales and transfers
4,714,821 125,238 123,375 268,917 263,087 (5,495,438) —
Total
12,186,737 6,222,914 3,013,128 2,719,329 1,882,900 (5,495,438) 20,529,570
Operating expenses
12,424,268 6,613,106 3,156,361 2,543,269 1,795,252 (5,541,675) 20,990,581
Operating income (loss)
¥ (237,531) ¥ (390,192) ¥ (143,233) ¥ 176,060 ¥ 87,648 ¥ 46,237 ¥ (461,011)
Assets
¥11,956,431 ¥10,685,466 ¥2,324,528 ¥1,547,890 ¥1,446,505 ¥ 1,101,217 ¥29,062,037
Long-lived assets
3,658,719 2,726,419 410,185 372,330 234,028 — 7,401,681
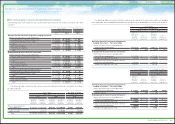
Yen in millions
Japan
North
America Europe Asia Other
Inter-segment
Elimination/
Unallocated
Amount Consolidated
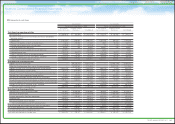
Net revenues
Sales to external customers
¥ 7,314,813 ¥ 5,583,228 ¥2,082,671 ¥2,431,648 ¥1,538,613 ¥ — ¥18,950,973
Inter-segment sales and transfers
3,905,490 87,298 64,378 223,679 135,248 (4,416,093) —
Total
11,220,303 5,670,526 2,147,049 2,655,327 1,673,861 (4,416,093) 18,950,973
Operating expenses
11,445,545 5,585,036 2,180,004 2,451,800 1,558,287 (4,417,215) 18,803,457
Operating income (loss)
¥ (225,242) ¥ 85,490 ¥ (32,955) ¥ 203,527 ¥ 115,574 ¥ 1,122 ¥ 147,516
Assets
¥12,465,677 ¥10,223,903 ¥2,060,962 ¥1,925,126 ¥1,803,703 ¥ 1,869,916 ¥30,349,287
Long-lived assets
3,347,896 2,401,172 351,037 361,296 249,500 — 6,710,901
Yen in millions
Japan
North
America Europe Asia Other
Inter-segment
Elimination/
Unallocated
Amount Consolidated
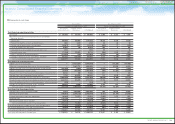
Net revenues
Sales to external customers
¥ 6,966,929 ¥5,327,809 ¥1,920,416 ¥3,138,112 ¥1,640,422 ¥ — ¥18,993,688
Inter-segment sales and transfers
4,019,317 101,327 61,081 236,422 168,694 (4,586,841) —
Total
10,986,246 5,429,136 1,981,497 3,374,534 1,809,116 (4,586,841) 18,993,688
Operating expenses
11,348,642 5,089,633 1,968,349 3,061,557 1,648,987 (4,591,759) 18,525,409
Operating income (loss)
¥ (362,396) ¥ 339,503 ¥ 13,148 ¥ 312,977 ¥ 160,129 ¥ 4,918 ¥ 468,279
Assets
¥11,285,864 ¥9,910,828 ¥1,931,231 ¥2,138,499 ¥2,044,379 ¥ 2,507,365 ¥29,818,166
Long-lived assets
3,123,042 2,276,332 305,627 344,304 259,855 — 6,309,160
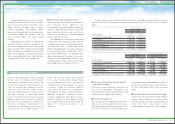
U.S. dollars in millions
Japan
North
America Europe Asia Other
Inter-segment
Elimination/
Unallocated
Amount Consolidated
Net revenues
Sales to external customers
$ 83,787 $ 64,075 $23,096 $37,740 $19,729 $ — $228,427
Inter-segment sales and transfers
48,339 1,218 734 2,844 2,028 (55,163) —
Total
132,126 65,293 23,830 40,584 21,757 (55,163) 228,427
Operating expenses
136,484 61,210 23,672 36,820 19,831 (55,222) 222,795
Operating income (loss)
$ (4,358) $ 4,083 $ 158 $ 3,764 $ 1,926 $ 59 $ 5,632
Assets
$135,729 $ 119,192 $23,226 $25,719 $24,587 $ 30,154 $358,607
Long-lived assets
37,559 27,376 3,676 4,141 3,125 — 75,877
As of and for the year ended March 31, 2010:
As of and for the year ended March 31, 2011:
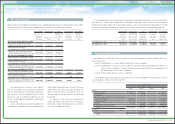
Revenues are attributed to geographies
based on the country location of the parent
company or the subsidiary that transacted the
sale with the external customer.
There are no any individually material countries
with respect to revenues, operating expenses,
operating income, assets and long-lived assets
included in other foreign countries.
Unallocated amounts included in assets
represent assets held for corporate purposes,
which mainly consist of cash and cash equivalents
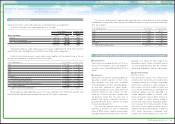
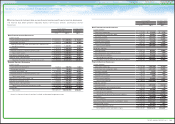
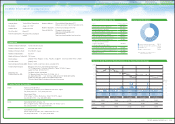
The following information shows revenues that are
attributed to countries based on location of
customers, excluding customers in Japan. In
addition to the disclosure requirements under
U.S.GAAP, Toyota discloses this information in
order to provide financial statement users with
valuable information.
and marketable securities. Such corporate assets
were ¥3,225,901 million, ¥4,205,402 million and
¥4,613,672 million ($55,486 million), as of March
31, 2009, 2010 and 2011, respectively.
Transfers between industries or geographic
segments are made at amounts which Toyota’s
management believes approximate arm’s-length
transactions. In measuring the reportable
segments’ income or losses, operating income
consists of revenue less operating expenses.
“Other” consists of Central and South America, Oceania and Africa.
“Other” consists of Central and South America, Oceania, Africa and the Middle East, etc.
Yen in millions
U.S. dollars in millions
For the years ended
March 31,
For the year ended
March 31,
2009 2010 2011 2011
North America ¥6,294,230 ¥5,718,381 ¥5,398,278 $64,922
Europe 2,861,351 2,023,280 1,793,932 21,575
Asia 2,530,352 2,641,471 3,280,384 39,451
Other 3,421,881 2,838,671 3,196,114 38,438
102
TOYOTA ANNUAL REPORT 2011