Toyota 2011 Annual Report Download - page 104
Download and view the complete annual report
Please find page 104 of the 2011 Toyota annual report below. You can navigate through the pages in the report by either clicking on the pages listed below, or by using the keyword search tool below to find specific information within the annual report.-
 1
1 -
2
-
3
-
4
-
5
-
6
-
7
-
8
-
9
-
10
-
11
-
12
-
13
-
14
-
15
-
16
-
17
-
18
-
19
-
20
-
21
-
22
-
23
-
24
-
25
-
26
-
27
-
28
-
29
-
30
-
31
-
32
-
33
-
34
-
35
-
36
-
37
-
38
-
39
-
40
-
41
-
42
-
43
-
44
-
45
-
46
-
47
-
48
-
49
-
50
-
51
-
52
-
53
-
54
-
55
-
56
-
57
-
58
-
59
-
60
-
61
-
62
-
63
-
64
-
65
-
66
-
67
-
68
-
69
-
70
-
71
-
72
-
73
-
74
-
75
-
76
-
77
-
78
-
79
-
80
-
81
-
82
-
83
-
84
-
85
-
86
-
87
-
88
-
89
-
90
-
91
-
92
-
93
-
 94
94 -
 95
95 -
 96
96 -
 97
97 -
 98
98 -
 99
99 -
 100
100 -
 101
101 -
 102
102 -
 103
103 -
 104
104 -
 105
105 -
 106
106 -
 107
107 -
 108
108 -
 109
109 -
 110
110 -
 111
111 -
 112
112 -
 113
113
 |
 |

0822
Financial Section and
Investor Information
Business and
Performance Review
Special FeatureMessage/Vision
Management and
Corporate Information
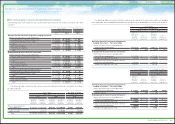
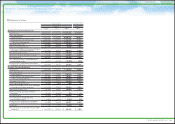
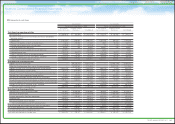
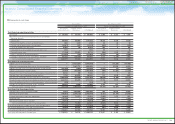
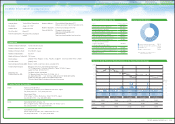
Notes to Consolidated Financial Statements
Statements of income
Yen in millions
U.S. dollars in millions
March 31, March 31,
2009 2010 2011 2011
Non-Financial Services Businesses
Net revenues ¥19,182,161 ¥17,732,143 ¥17,826,986 $214,395
Costs and expenses
Cost of revenues 17,470,791 15,973,442 15,986,741 192,264
Selling, general and administrative 2,097,674 1,854,710 1,723,071 20,722
Total costs and expenses 19,568,465 17,828,152 17,709,812 212,986
Operating income (loss) (386,304) (96,009) 117,174 1,409
Other income (expense), net (71,925) 144,625 88,840 1,069
Income (loss) before income taxes and equity
in earnings of affiliated companies (458,229) 48,616 206,014 2,478
Provision for income taxes (10,152) 42,342 178,795 2,150
Equity in earnings of affiliated companies 53,226 109,944 214,229 2,576
Net income (loss) (394,851) 116,218 241,448 2,904
Less: Net (income) loss attributable to the
noncontrolling interest 26,282 (32,103) (54,055) (650)
Net income (loss) attributable to Toyota Motor
Corporation- Non-Financial Services Businesses
(368,569) 84,115 187,393 2,254
Financial Services Businesses
Net revenues 1,377,548 1,245,407 1,192,205 14,338
Costs and expenses
Cost of revenues 994,191 716,997 636,374 7,653
Selling, general and administrative 455,304 281,483 197,551 2,376
Total costs and expenses 1,449,495 998,480 833,925 10,029
Operating income (loss) (71,947) 246,927 358,280 4,309
Other income (expense), net (30,233) (3,923) 1,349 16
Income (loss) before income taxes and equity
in earnings of affiliated companies (102,180) 243,004 359,629 4,325
Provision for income taxes (46,298) 50,362 134,094 1,613
Equity in earnings (losses) of affiliated
companies (10,502) (64,536) 787 10
Net income (loss) (66,384) 128,106 226,322 2,722
Less: Net income attributable to the
noncontrolling interest (2,004) (2,653) (3,251) (39)
Net income (loss) attributable to Toyota Motor
Corporation- Financial Services Businesses
(68,388) 125,453 223,071 2,683
Eliminations 20 (112) (2,281) (28)
Net income (loss) attributable to Toyota Motor
Corporation ¥ (436,937) ¥ 209,456 ¥ 408,183 $ 4,909
104
TOYOTA ANNUAL REPORT 2011