Toyota 2011 Annual Report Download - page 105
Download and view the complete annual report
Please find page 105 of the 2011 Toyota annual report below. You can navigate through the pages in the report by either clicking on the pages listed below, or by using the keyword search tool below to find specific information within the annual report.-
 1
1 -
2
-
3
-
4
-
5
-
6
-
7
-
8
-
9
-
10
-
11
-
12
-
13
-
14
-
15
-
16
-
17
-
18
-
19
-
20
-
21
-
22
-
23
-
24
-
25
-
26
-
27
-
28
-
29
-
30
-
31
-
32
-
33
-
34
-
35
-
36
-
37
-
38
-
39
-
40
-
41
-
42
-
43
-
44
-
45
-
46
-
47
-
48
-
49
-
50
-
51
-
52
-
53
-
54
-
55
-
56
-
57
-
58
-
59
-
60
-
61
-
62
-
63
-
64
-
65
-
66
-
67
-
68
-
69
-
70
-
71
-
72
-
73
-
74
-
75
-
76
-
77
-
78
-
79
-
80
-
81
-
82
-
83
-
84
-
85
-
86
-
87
-
88
-
89
-
90
-
91
-
92
-
93
-
94
-
 95
95 -
 96
96 -
 97
97 -
 98
98 -
 99
99 -
 100
100 -
 101
101 -
 102
102 -
 103
103 -
 104
104 -
 105
105 -
 106
106 -
 107
107 -
 108
108 -
 109
109 -
 110
110 -
 111
111 -
 112
112 -
 113
113
 |
 |

0822
Financial Section and
Investor Information
Business and
Performance Review
Special FeatureMessage/Vision
Management and
Corporate Information
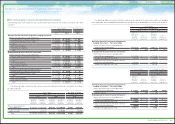
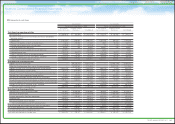
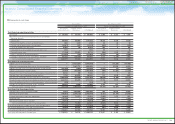
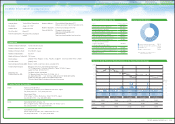
Notes to Consolidated Financial Statements
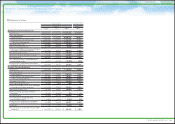
Statements of cash flows
Yen in millions Yen in millions
For the year ended March 31, 2009 For the year ended March 31, 2010
Non-Financial
Services Businesses
Financial Services
Businesses Consolidated
Non-Financial
Services Businesses
Financial Services
Businesses Consolidated
Cash flows from operating activities
Net income (loss) ¥ (394,851) ¥ (66,384) ¥ (461,215) ¥ 116,218 ¥ 128,106 ¥ 244,212
Adjustments to reconcile net income (loss) to net cash provided by
operating activities
Depreciation 1,105,233 389,937 1,495,170 1,065,749 348,820 1,414,569
Provision for doubtful accounts and credit losses (1,663) 259,096 257,433 1,905 98,870 100,775
Pension and severance costs, less payments (21,428) 470 (20,958) 55 1,199 1,254
Losses on disposal of fixed assets 68,546 136 68,682 46,661 276 46,937
Unrealized losses on available-for-sale securities, net 220,920 — 220,920 2,486 — 2,486
Deferred income taxes (132,127) (62,871) (194,990) (14,183) 39,759 25,537
Equity in (earnings) losses of affiliated companies (53,226) 10,502 (42,724) (109,944) 64,536 (45,408)
Changes in operating assets and liabilities, and other (223,101) 186,234 154,587 733,338 133,275 768,168
Net cash provided by operating activities 568,303 717,120 1,476,905 1,842,285 814,841 2,558,530
Cash flows from investing activities
Additions to finance receivables — (14,230,272) (8,612,111) — (13,492,119) (7,806,201)
Collection of and proceeds from sales of finance receivables — 13,959,045 8,155,094 — 13,107,531 7,517,968
Additions to fixed assets excluding equipment leased to others (1,358,518) (6,064) (1,364,582) (599,154) (5,382) (604,536)
Additions to equipment leased to others (82,411) (877,904) (960,315) (64,345) (768,720) (833,065)
Proceeds from sales of fixed assets excluding equipment leased to others
41,285 6,101 47,386 46,070 6,403 52,473
Proceeds from sales of equipment leased to others 55,896 472,853 528,749 36,668 428,424 465,092
Purchases of marketable securities and security investments (418,342) (217,688) (636,030) (2,310,912) (101,270) (2,412,182)
Proceeds from sales of and maturity of marketable securities and security investments
1,295,561 180,316 1,475,877 1,012,781 95,960 1,108,741
Payment for additional investments in affiliated companies, net of cash acquired
(45) — (45) (1,020) — (1,020)
Changes in investments and other assets, and other 129,834 (2,091) 135,757 (259,089) 102,497 (337,454)
Net cash used in investing activities (336,740) (715,704) (1,230,220) (2,139,001) (626,676) (2,850,184)
Cash flows from financing activities
Proceeds from issuance of long-term debt 545,981 3,030,029 3,506,990 492,300 2,733,465 3,178,310
Payments of long-term debt (150,097) (2,580,637) (2,704,078) (77,033) (2,926,308) (2,938,202)
Increase (decrease) in short-term borrowings 138,387 239,462 406,507 (249,238) (251,544) (335,363)
Dividends paid (439,991) — (439,991) (172,476) — (172,476)
Purchase of common stock, and other (70,587) — (70,587) (10,251) — (10,251)
Net cash provided by (used in) financing activities 23,693 688,854 698,841 (16,698) (444,387) (277,982)
Effect of exchange rate changes on cash and cash equivalents (80,214) (49,579) (129,793) 4,092 (12,990) (8,898)
Net increase (decrease) in cash and cash equivalents 175,042 640,691 815,733 (309,322) (269,212) (578,534)
Cash and cash equivalents at beginning of year 1,473,101 155,446 1,628,547 1,648,143 796,137 2,444,280
Cash and cash equivalents at end of year ¥ 1,648,143 ¥ 796,137 ¥ 2,444,280 ¥ 1,338,821 ¥ 526,925 ¥ 1,865,746
105
TOYOTA ANNUAL REPORT 2011