Toyota 2011 Annual Report Download - page 74
Download and view the complete annual report
Please find page 74 of the 2011 Toyota annual report below. You can navigate through the pages in the report by either clicking on the pages listed below, or by using the keyword search tool below to find specific information within the annual report.-
 1
1 -
2
-
3
-
4
-
5
-
6
-
7
-
8
-
9
-
10
-
11
-
12
-
13
-
14
-
15
-
16
-
17
-
18
-
19
-
20
-
21
-
22
-
23
-
24
-
25
-
26
-
27
-
28
-
29
-
30
-
31
-
32
-
33
-
34
-
35
-
36
-
37
-
38
-
39
-
40
-
41
-
42
-
43
-
44
-
45
-
46
-
47
-
48
-
49
-
50
-
51
-
52
-
53
-
54
-
55
-
56
-
57
-
58
-
59
-
60
-
61
-
62
-
63
-
 64
64 -
 65
65 -
 66
66 -
 67
67 -
 68
68 -
 69
69 -
 70
70 -
 71
71 -
 72
72 -
 73
73 -
 74
74 -
 75
75 -
 76
76 -
 77
77 -
 78
78 -
 79
79 -
 80
80 -
 81
81 -
 82
82 -
 83
83 -
 84
84 -
85
-
86
-
87
-
88
-
89
-
90
-
91
-
92
-
93
-
94
-
95
-
96
-
97
-
98
-
99
-
100
-
101
-
102
-
103
-
104
-
105
-
106
-
107
-
108
-
109
-
110
-
111
-
112
-
113
 |
 |

0822
Financial Section and
Investor Information
Business and
Performance Review
Special FeatureMessage/Vision
Management and
Corporate Information
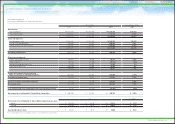
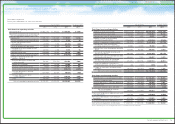
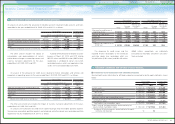
Consolidated Statements of Cash Flows
Yen in millions
U.S. dollars in millions
2009 2010 2011 2011
Cash flows from operating activities
Net income (loss) ¥ (461,215) ¥ 244,212 ¥ 465,485 $ 5,598
Adjustments to reconcile net income (loss) to
net cash provided by operating activities
Depreciation 1,495,170 1,414,569 1,175,573 14,138
Provision for doubtful accounts and credit losses
257,433 100,775 4,140 50
Pension and severance costs,
less payments (20,958) 1,254 (23,414) (282)
Losses on disposal of fixed assets 68,682 46,937 36,214 436
Unrealized losses on available-for-sale
securities, net 220,920 2,486 7,915 95
Deferred income taxes (194,990) 25,537 85,710 1,031
Equity in earnings of affiliated companies (42,724) (45,408) (215,016) (2,586)
Changes in operating assets and
liabilities, and other
(Increase)
decrease in accounts and
notes receivable
791,481 (576,711) 421,423 5,068
Decrease in inventories 192,379 56,059 51,808 623
Decrease in other current assets
9,923 97,494 38,307 461
Increase (decrease) in accounts payable
(837,402) 649,214 (406,210) (4,885)
Increase (decrease) in accrued
income taxes (251,868) 102,207 (40,629) (489)
Increase (decrease) in other
current liabilities (41,819) 213,341 239,319 2,878
Other 291,893 226,564 183,384 2,206
Net cash provided by operating activities
¥1,476,905 ¥2,558,530 ¥2,024,009 $24,342
Yen in millions
U.S. dollars in millions
2009 2010 2011 2011
Cash flows from investing activities
Additions to finance receivables ¥(8,612,111) ¥(7,806,201) ¥(8,438,785) $(101,488)
Collection of finance receivables 8,143,804 7,509,578 7,934,364 95,422
Proceeds from sales of finance receivables 11,290 8,390 69,576 837
Additions to fixed assets excluding
equipment leased to others (1,364,582) (604,536) (629,326) (7,569)
Additions to equipment leased to others (960,315) (833,065) (1,061,865) (12,770)
Proceeds from sales of fixed assets
excluding equipment leased to others 47,386 52,473 51,342 618
Proceeds from sales of equipment leased to
others 528,749 465,092 486,695 5,853
Purchases of marketable securities and
security investments (636,030) (2,412,182) (4,421,807) (53,179)
Proceeds from sales of marketable securities
and security investments 800,422 77,025 189,037 2,273
Proceeds upon maturity of marketable
securities and security investments 675,455 1,031,716 3,527,119 42,419
Payment for additional investments in
affiliated companies, net of cash acquired (45) (1,020) (299) (4)
Changes in investments and other assets,
and other 135,757 (337,454) 177,605 2,136
Net cash used in investing activities ¥(1,230,220) ¥(2,850,184) ¥(2,116,344) $ (25,452)
Cash flows from financing activities
Proceeds from issuance of long-term debt ¥ 3,506,990 ¥ 3,178,310 ¥ 2,931,436 $ 35,255
Payments of long-term debt (2,704,078) (2,938,202) (2,489,632) (29,942)
Increase (decrease) in short-term borrowings 406,507 (335,363) 162,260 1,951
Dividends paid (439,991) (172,476) (141,120) (1,697)
Purchase of common stock, and other (70,587) (10,251) (28,617) (344)
Net cash provided by (used in)
financing activities 698,841 (277,982) 434,327 5,223
Effect of exchange rate changes on cash and
cash equivalents (129,793) (8,898) (127,029) (1,528)
Net increase (decrease) in cash and cash
equivalents 815,733 (578,534) 214,963 2,585
Cash and cash equivalents at beginning of year
1,628,547 2,444,280 1,865,746 22,439
Cash and cash equivalents at end of year ¥ 2,444,280 ¥ 1,865,746 ¥ 2,080,709 $ 25,024
Toyota Motor Corporation
For the years ended March 31, 2009, 2010 and 2011
The accompanying notes are an integral part of these consolidated financial statements.
74
TOYOTA ANNUAL REPORT 2011